
2
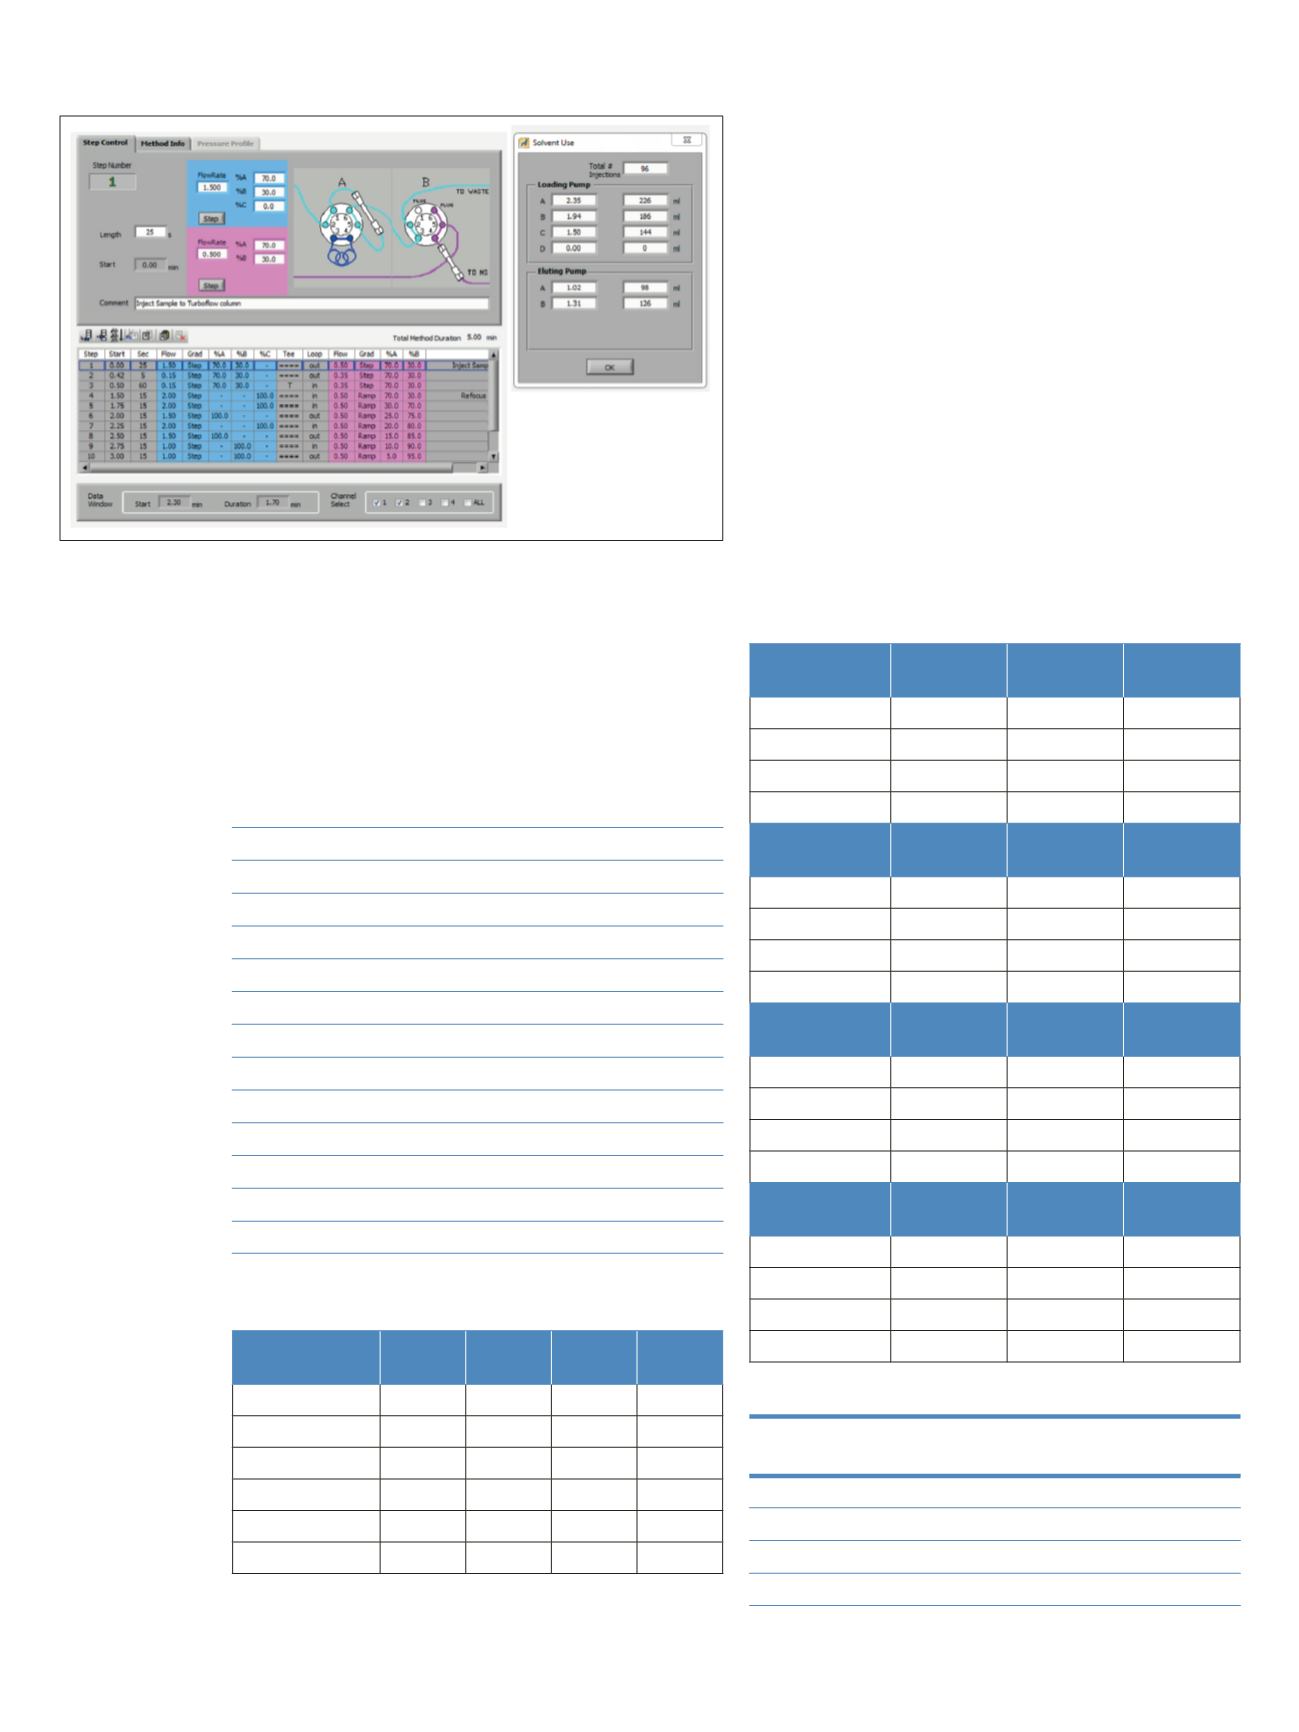
Figure 1. SPLC method profile
MS Method
Analyte detection was performed on a
TSQ Endura MSequipped with a heated electrospray ionization (HESI)
source. Table 1 shows MS conditions and Table 2 shows
the selected-reaction monitoring (SRM) transitions for all
four drugs and the two internal standards.
Table 1. MS conditions
Ionization
Heated electrospray ionization
Vaporizer temp
450 °C
Capillary temp
200 °C
Spray voltage
3500 V
Sheath gas
52 AU
Auxiliary gas
20 AU
Data acquisition mode
Selected-reaction monitoring (SRM)
Chrom filter peak width
3 s
Collision gas pressure
2 mTorr
Cycle time
0.2 s
Q1 (FWMH)
0.7
Q3 (FWMH)
0.7
SRM parameters
Refer to Table 2
Table 2. SRM Parameters
Calibrators and Controls
Whole blood calibrators for the immunosuppressant
drugs and quality control (QC) samples were purchased
from ChromSystems Instruments & Chemicals GmbH.
Vendor instructions were followed to reconstitute the
lyophilized calibrators and controls.
Results and Discussion
Data were acquired and processed with
Thermo Scientific ™ TraceFinder ™ software version 3.1.Figure 2 shows a
representative chromatogram of the calibration standard
at the lowest level. All calibration curves were linear with
R
2
values greater than 0.9943. All of the QC samples
were within 20% of the manufacturer-specified
concentrations (Table 3). Table 4 shows the linearity
range and R
2
values, and Figure 3 shows representative
calibration curves for all four drugs. Figure 4 shows the
extracted ion chromatogram along with the calculated
concentrations for tacrolimus and sirolimus from different
donor samples.
Total solvent consumption is
3.37 mL A, 3.25 mL B, 1.5 C
for each injection
Table 3. Accuracy of QC samples
Table 4. Linearity ranges
Compound
Linear Range
R
2
Name
(ng/mL)
Tacrolimus
2.1–38.5
0.9971
Cyclosporine A
23.3–919
0.9951
Sirolimus
2.3–46.1
0.9943
Everolimus
2.2–41.1
0.9973
Compound
Name
Q1
(
m/z
)
Q3
(
m/z
)
RF
Lens
Collision
Energy
Tacrolimus
821.6 768.5
224
24
13
CD
2
-Tacrolimus
824.6 771.6
224
24
Cyclosporine A
1202.8 425.4
250
58
D
12
-Cyclosporine A 1214.8 437.4
250
58
Sirolimus
931.7 864.5
250
23
Everolimus
975.5 908.5
224
23
Sirolimus
Theoretical
Amount
Calculated
Amount
Difference
(%)
QC1
2.90
2.66
-8.41
QC2
10.1
10.8
6.78
QC3
20.4
22.4
9.63
QC4
38.5
35.8
-7.09
Cyclosporin A Theoretical
Amount
Calculated
Amount
Difference
(%)
QC1
53.0
56.9
7.37
QC2
276
320
15.8
QC3
514
500
-2.75
QC4
1110
1190
6.77
Everolimus Theoretical
Amount
Calculated
Amount
Difference
(%)
QC1
2.30
2.21
-3.83
QC2
4.40
3.80
-13.6
QC3
8.50
9.42
10.8
QC4
28.8
27.1
-5.89
Tacrolimus Theoretical
Amount
Calculated
Amount
Difference
(%)
QC1
2.60
3.04
16.8
QC2
7.30
7.66
4.86
QC3
16.7
17.4
4.08
QC4
34.2
32.3
-5.60


