
2
MS Method
MS analysis was performed on
a TSQ Endura triple quadrupole mass spectrometer(Figure 1). The MS
conditions were as follows:
Ionization:
Heated electrospray ionization (HESI)
Vaporizer temp:
400 °C
Capillary temp:
250 °C
Spray Voltage:
1000 V
Sheath gas:
45 AU
Auxiliary gas:
5 AU
Sweep gas:
1 AU
Data acquisition mode:
Selected-reaction monitoring (SRM)
Chrom filter peak width:
3 s
Collision gas pressure:
2 mTorr
Cycle time:
0.5 s
Q1 (FWMH):
0.7
Q3 (FWMH):
0.7
SRM parameters:
Refer to Table 2
Table 2. SRM transitions
Results and Discussion
All data were acquired and processed wit
h Thermo Scientific ™ TraceFinder ™ software version 3.1.The high selectivity of
SRM detection using the TSQ Endura triple quadrupole
mass spectrometer makes it possible the use of rapid
chromatographic separation (2 min) on a short, 10 mm
column achieving chromatographic peaks with excellent
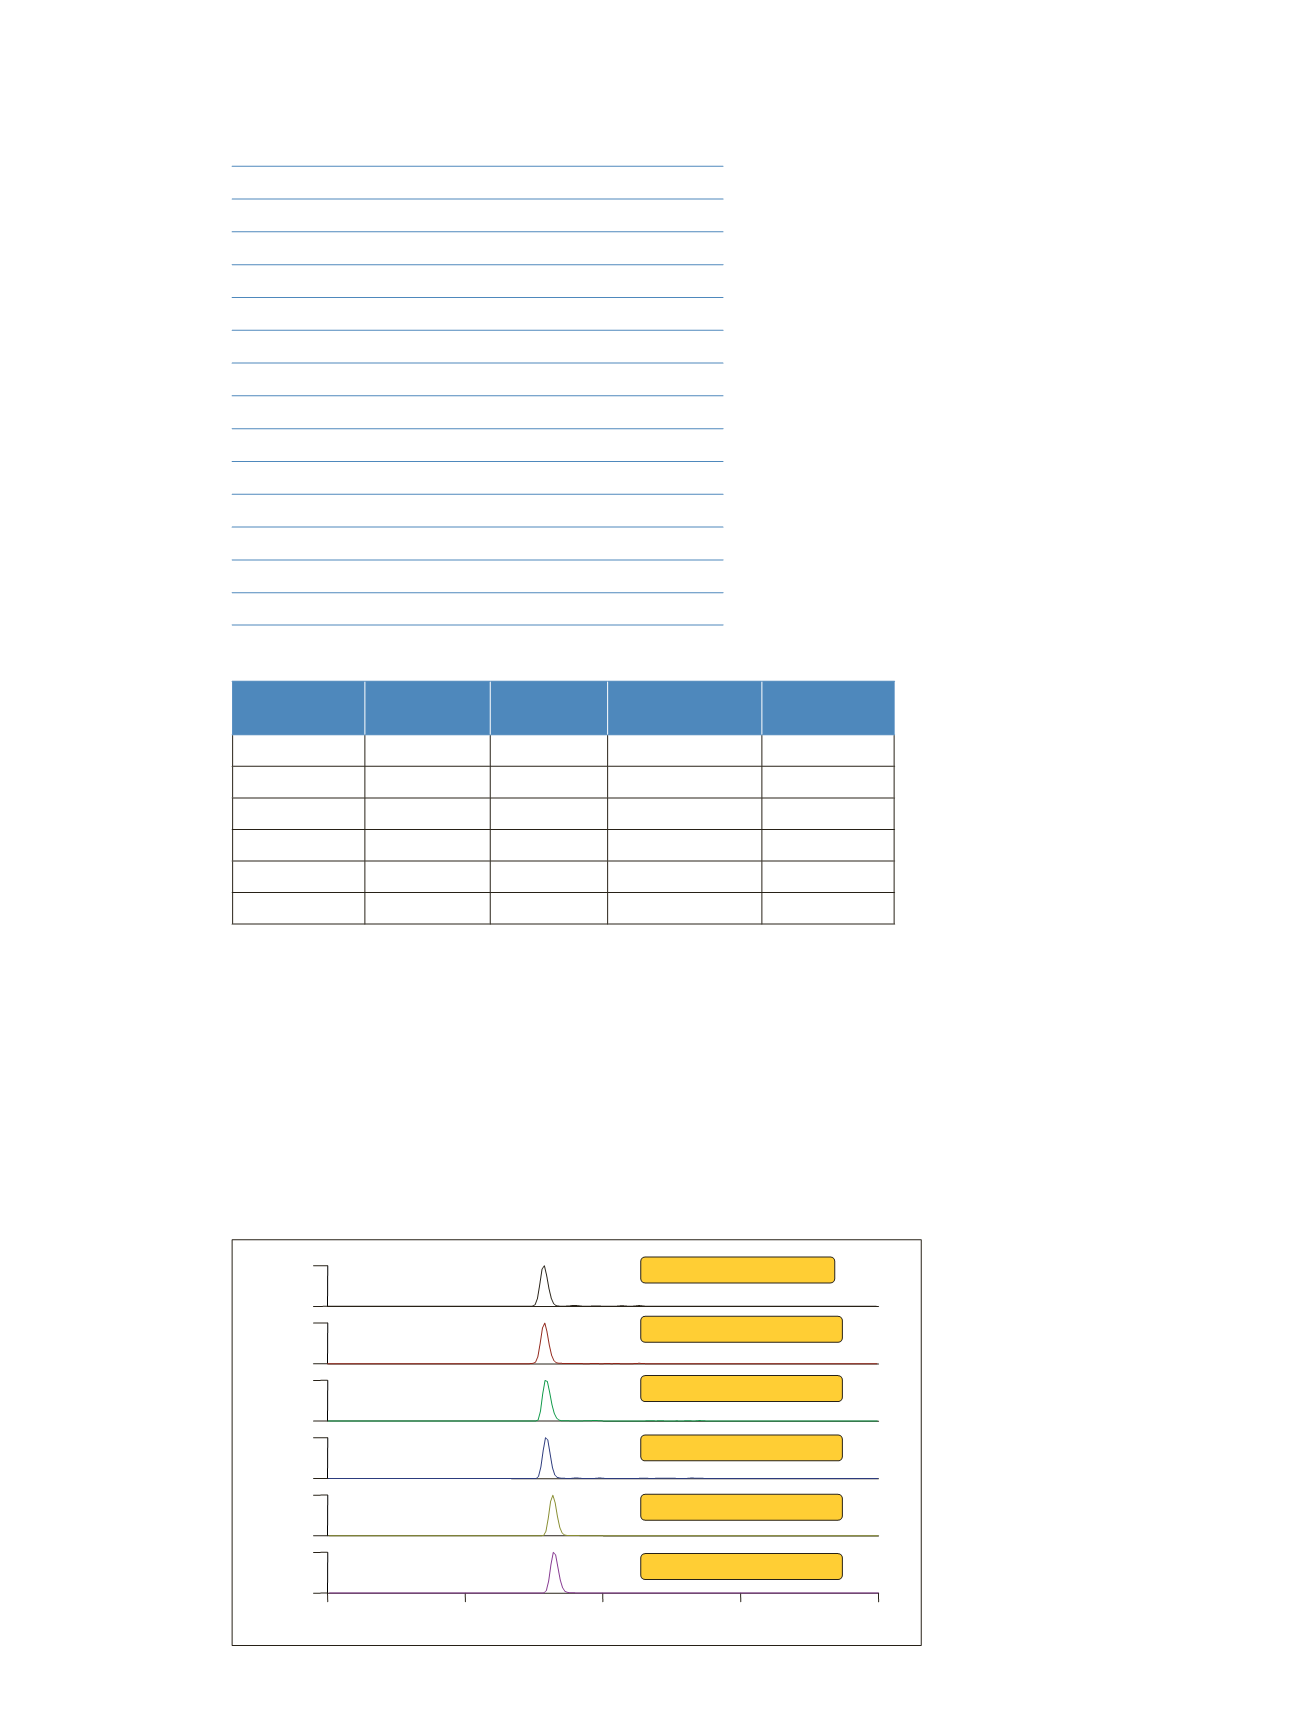
shape (Figure 1). Internal calibration curves were built for
each analyte (Figures 2–4). QC and donor samples were
analyzed in triplicate resulting with good correlation
between spiked and measured results (Table 3).
Compound Precursor
(
m/z
)
Product
(
m/z
)
Collision Energy
(V)
RF Lens
(V)
Ascomycin
809.75
756.4
21
203
Tacrolimus
821.6
768.45
20
187
Sirolimus
931.85
864.5
17
191
Sirolimus-d3
934.85
864.5
17
191
Cyclosporin A
1220
1202.8
17
224
Cyclosporin D
1234
1216.85
17
200
Ascomycin
Tacrolimus
Sirolimus
d
3
Sirolimus
Cyclosporin A
Cyclosporin D
0.0
0.5
1.0
1.5
2.0
Time (min)
0
100
0
100
0
100
0
100
Relative Abundance
0
100
0
100
0.79
0.79
0.79
0.79
0.82
0.82
Figure 1. Chromatography


