5
Thermo Scientific Poster Note
•
PN ASMS13_T219_EDamoc_e 07/13S
an showing baseline isotopically
tibody. 500 transients with a
rbitrap Elite instrument.
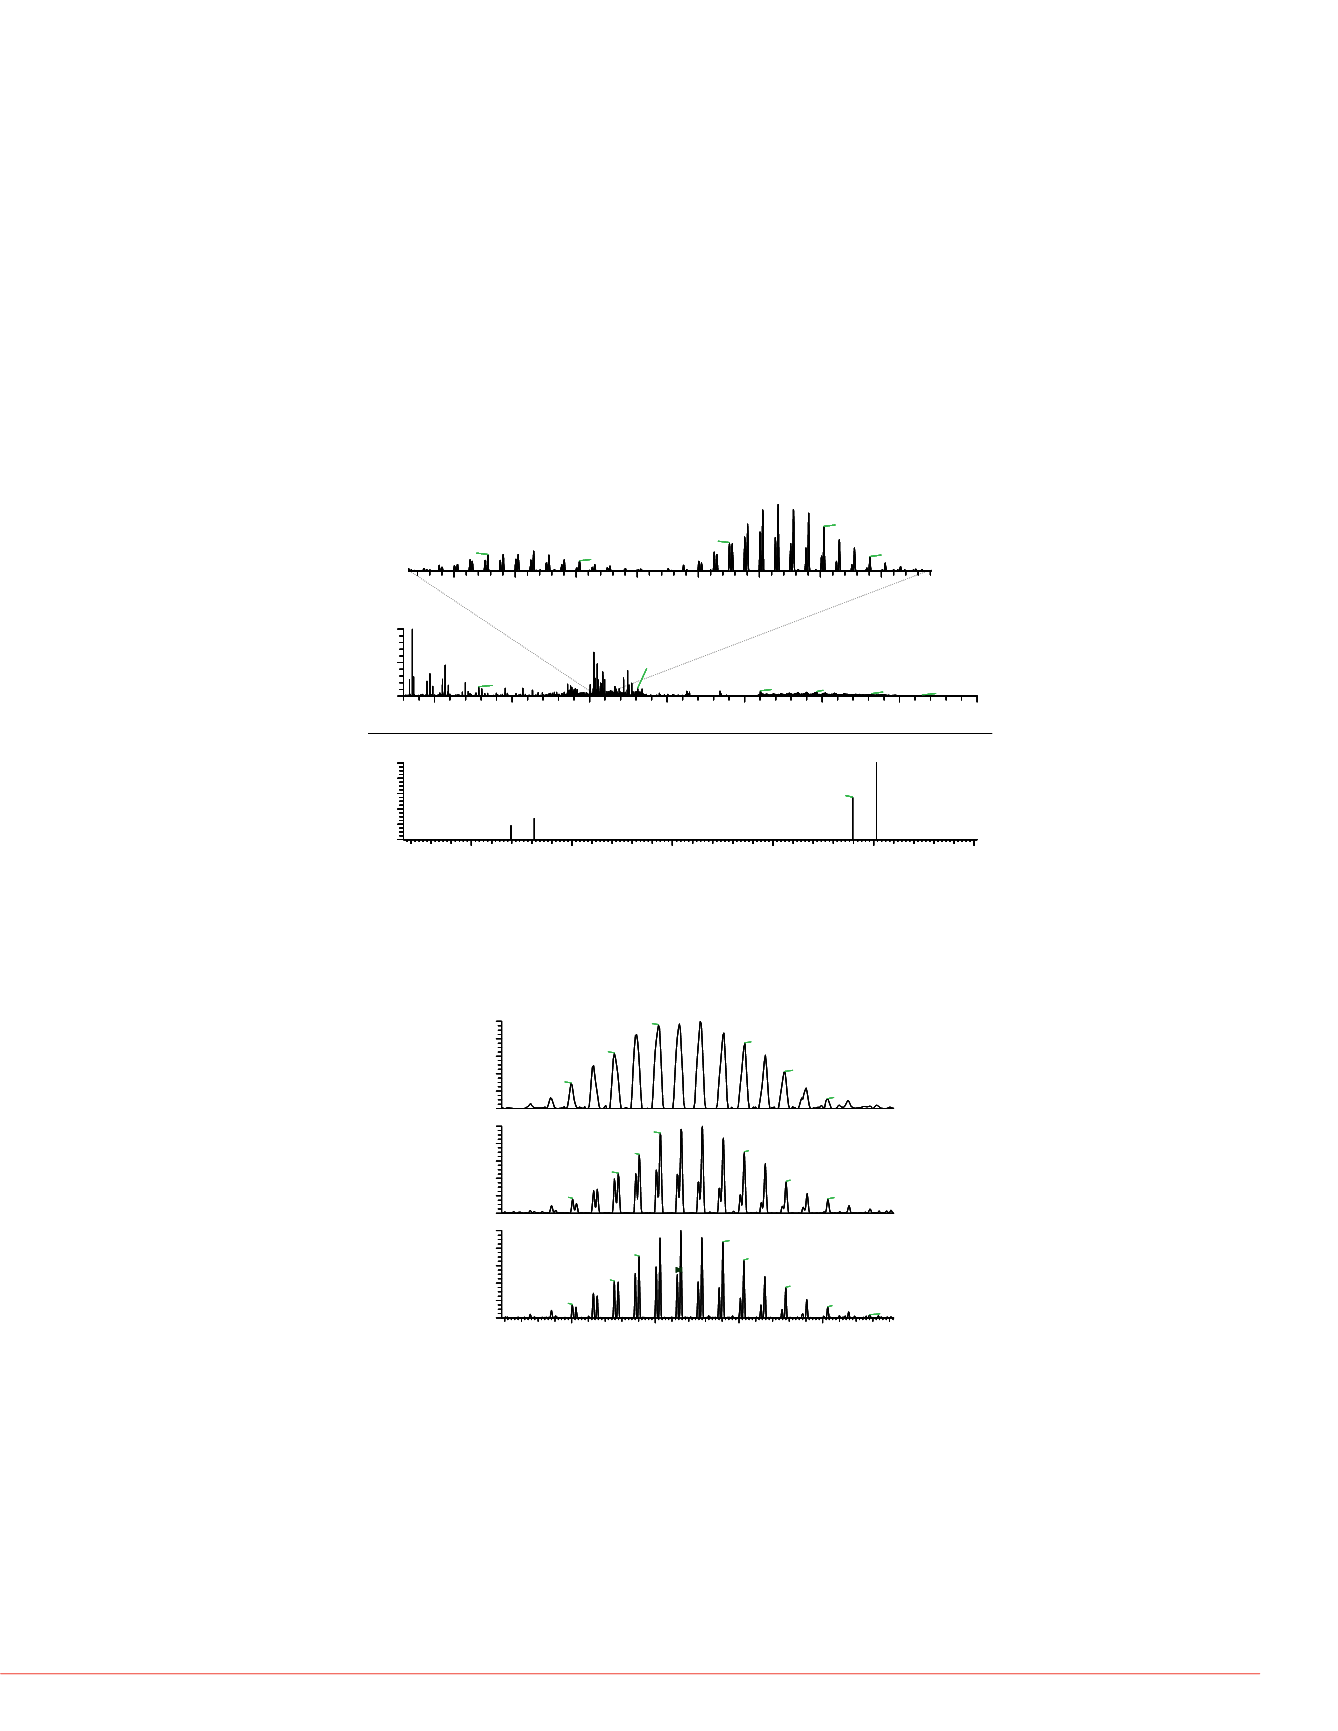
FIGURE 8. EThcD mass spect
form.
100
Based on work done by Horn
et al.
[4], we decided to acquire HCD spectra of the
intact Herceptin mAb on the Orbitrap Elite mass spectrometer at three different
resolution settings (120,000; 240,000; and 480,000 at
m/z
400) to check if ultrahigh
resolving power is required to resolve possible overlapping isotopic clusters. An
example showing the need of ultrahigh resolving power for the top-down analysis of
2907.27563
R=339004
2907.43384
R=348304
G0F+G1F
[M+51H]
51+
70
80
90
1802.3
R=10
z=
414.19843
R=225401
z=1
intact antibodies is illustrated in Figures 6 and 7. The HCD spectrum of the intact
Herceptin mAb shows baseline resolved overlapping isotopic patterns of b
115
(light
chain) and b
113
(heavy chain) 8+ fragment ions at a resolution setting of 480,000
(Developer’s Kit only). At a lower resolution setting of 240,000, these two overlapping
isotopic patterns with a delta of 22 mmu are partially resolved making still possible the
2907.68774
R=374704
2907.76611
R=363604
2907.96045
R=345904 2908.31396
R=322904
40
50
60
elative Abundance
1487.35107
R=115000
z=8
734.35059
R 170001
unambiguous assignment of both fragment ions. Lowering the resolution further, to
120,000, it is not possible to resolve and unambiguously assign these two different
fragment ions.
FIGURE 6 HCD mass spectrum of Herceptin antibody in denatured form
907.0
2907.5
2908.0
m/z
10
20
30
R
=
z=1
1558.15320
R=194700
.
showing baseline resolved overlapping isotopic patterns of b
115
(light chain)
and b
113
(heavy chain) fragment ions at a resolution setting of 480,000.
8+
8+
FIGURE 9. ProSightPC softwa
813
04
44
45
46
47
48
49
50
51
52
53
54
55
56
57
58
59
60
61
Relative Intensity
8.1702
16.1770
23.8689
1313.4683
40.3564
1329.9382
2814.1560
48.9254450.6222
1026.8643
2384.3368
839.1848
1406.4265
2599.9684
1839.53582008.9512
2947.1843
3 sec transient
500
1000
1500
0
1555.0
1555.5
1556.0
1556.5
1557.0
1557.5
1558.0
1558.5
1559.0
m/z
z=8
1558.52917
R=187104
z=8
1557.75525
R=199204
1556.15149
R=193004
1555.77637
R=187004
1558.90479
R=177204
z=8
1556.52747
R=187804
z=8
z=8
z=8
z=8
* * * * * * * *
**
***
*
*
* * * * * *
******
*
- NH3
in Denatured and Native Forms
Herceptin antibody in denatur
2925
0
200
400
600
800
1000 1200 1400 1600 1800 2000 2200 2400 2600 2800 3000
m/z
38
39
40
41
42
43
Time (msec)
0
50
100
Relative Abundance
1527.74353
R=197300
z=8
569.32831
R=356501
z=1
1358.21777
R=208000
z=9
785.40265
R=287201
z=1
1811.02368
R=178200
z=7
2341.35620
R=150400
z=10
2601.61914
R=140400
z=9
2963.13013
R=170604
z=?
3320.76929
R=172004
z=?
3646.76025
R=155701
z=1
b
115
(light chain)
*
b
113
(heavy chain)
*
HCD spectrum
natured conditions showed very
leavage sites and total number of
oth cases most of the assigned
e regions. The central portion of the
six backbone cleavages confirmed
500
1000
1500
2000
2500
3000
3500
4000
m/z
40
60
80
100
Abundance
12450.14772
12448.96697
*
*
-2.9ppm
-2 3ppm
Deconvoluted HCD spectrum
- NH3
. Good sequence coverage was also
where pyroglutamate formation at
ariable and first constant domain,
inal part of the heavy chain were
avy chains which was not
12430
12435
12440
12445
12450
12455
m/z
0
20
Relative
12433.13041
.
FIGURE 7 Overlapping isotopic patterns of b (light chain) and b (heavy
8+
8+
esence of disulfide-bridges and
native form which is most probably
100
1558.27100
R=41300
1558.02014
R 37204
.
115
113
chain) fragment ions measured on Orbitrap Elite mass spectrometer at three
different resolution settings.
Conclusion
Orbitrap top-down analysi
characterization of therap
Ultrahigh resolving power
ody in denatured and native
a were acquired using modified
100
0
20
40
60
80
=
1558.53320
R=45904
1557.75598
R=39904
1558.77185
R=44904
1557.49780
R=57104
1559.02856
R=59404
1558.28101
R=113900
1558.03064
R=120k@400
high-field Orbitrap instrum
kDa intact antibody.
Ultrahigh resolving power
overlapping isotopic clust
100
0
20
40
60
80
RelativeAbundance
R=114004
1558.53137
R=113104
1557.90466
R=114604
1557.77954
R=116604
1558.78174
R=110904
1557.50610
R=118104
1559.03113
R=114804
1558.15320
R=194700 1558 40393
R=240k@400
*
* * *
* *
* * * *
*
*
*
*
**
* * * * * * *
* * * * *
*
*
8
References
1. Denisov
et al., Int. J. Mas
2 Lange
et al
Presented at
(Glu
Pyro-Glu)
22 mmu
1557.5
1558.0
1558.5
1559.0
m/z
0
20
40
60
80
.
R=193304
1557.90295
R=194104
1558.52917
R=187104
1557.75525
R=199204
1558.77966
R=189104
1557.50427
R=184504
1559.03052
R=177804 1559.27942
R=99604
R=480k@400
* *
*
*
*
* **
*
*
* * * *
* ** * *
**
* * * * * *
b
115
(light chain)
*
b
113
(heavy chain)
*
+
8+
.
.,
Allied Topics, Denver, CO
3. Shaw JB and Brodbelt JS
4. Horn
et al.,
Presented at t
Allied Topics, Vancouver,
To further improve the sequence coverage, a combination of ETD and HCD (EThcD)
was performed on the intact Herceptin antibody in denatured conditions (Figure 8 and
Figure 9). Averaging 768 msec transients for 30 min (1350 uscans) in a direct infusion
Acknowledgem
We would like to thank Jared Sh
Herceptin is a trademark of Genentech Inc
a trademark of Positive Probability Ltd. Al
subsidiaries.
This information is not intended to enco
intellectual property rights of others For re
experiment resulted in identification of 125 fragment ions (62c + 29z, 25b + 9y) from
the light chain and 138 fragment ions (35c + 52z, 19b + 32y) from the heavy chain.
This corresponds to a sequence coverage of 38.5% for the light chain and 23.7% for
heavy chain. The total sequence coverage was 28.4%.
.


