6
Conclusion
In this study, a workflow was developed that combines high resolution Orbitrap
MS, fast chromatography, high throughput msx HCD and accurate data analysis
to characterize intact mAb. The precise mass measurement and extensive, high
confident amino acid sequence obtained from this workflow provides the
following information for intact mAb and its substructure:
•
Accurate measurement of intact molecular mass
•
Reproducible quantification of glycoform relative abundance
•
Confident amino acid sequence information and structural information
les on the Q Exactive
sample was analyzed
t days. The results for
tive abundance of the
for the 5 most
mAbs on multiple
not all the data are
werful platform for
orms
ithin a few percent.
2F G1F+G2F
-18.0
-12.0
5.6
-5.9
-12.9
-10.1
2F G1F+G2F
23.4
22.0
23.6
21.6
21.0
21.6
4.4%
LCMS
ab heavy chain
ein level mass error
(ppm)
6.4
0.7
0.7
30% backbone fragments
Light chain
Fab heavy chain
34% backbone fragments
P Score = 2.2E-34
P Score = 4.9E-19
partially reduced light chain
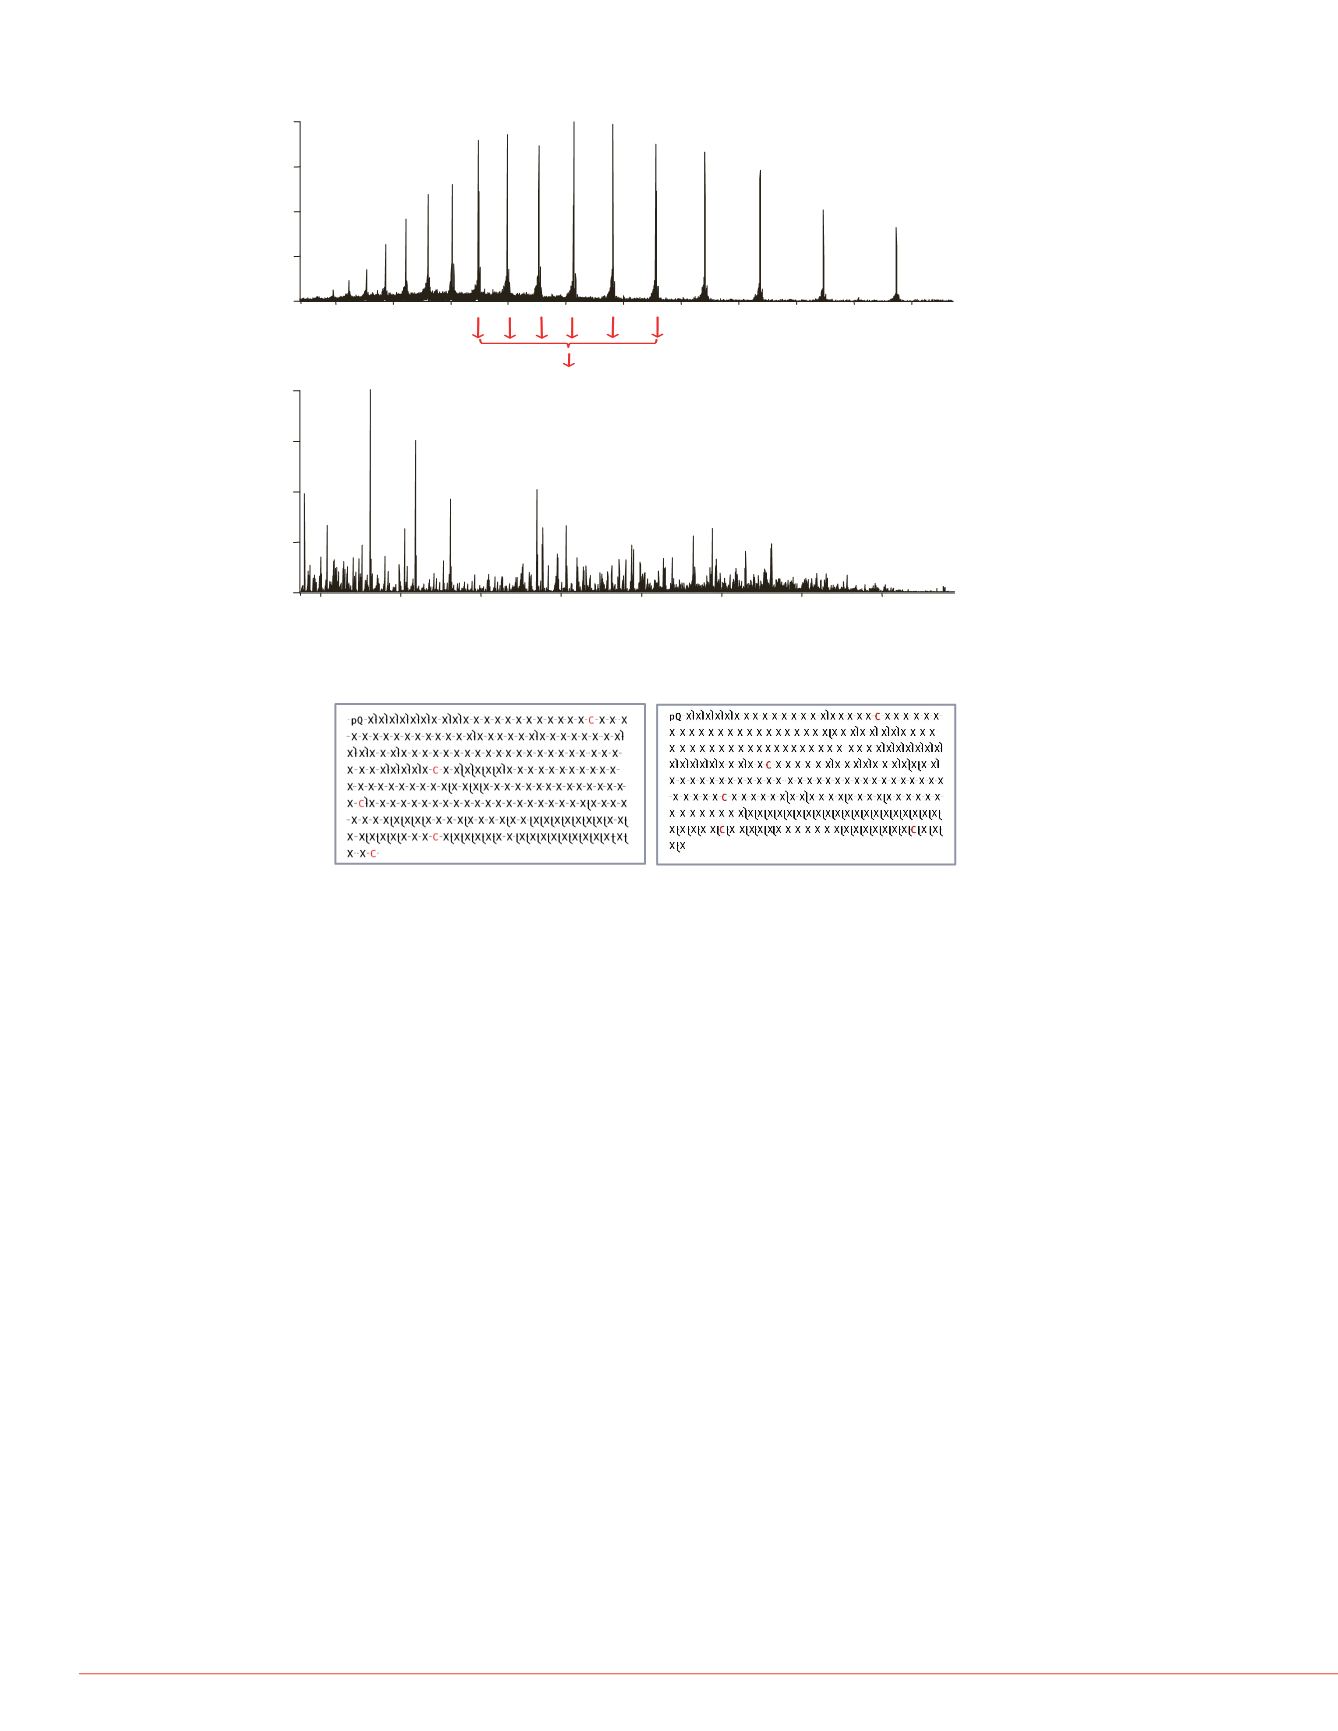
Figure 4: Top-down sequencing of light and Fab heavy chain using LC-MS/MS
Figure 5: Top-down sequencing maps disulfide linkage on partially reduced light chain
Top-down HCD
ProSight PC
Besides molecular mass, amino acid sequence can be obtained at the intact protein level using
a top-down LC-MS/MS approach. High resolution top-down HCD was performed using a
multiplexing mode where multiple precursors, which were the same protein molecule carrying
different number of charges, were isolated, fragmented separately and the resulting fragment
ions were then detected all together in a single Orbitrap detection event (Figure 4 top). More
than 30% of fragments from backbone cleavage were detected for both light chain and Fab
heavy chain (Figure 4 bottom) with excellent P score from ProSight PC software.
Top-down sequencing was also performed on a partially reduced light chain which is 4.02 Da
less in molecular mass than the fully reduced species. Analysis of the HCD spectrum in
ProSight PC software matched two disulfide linkages, which is typical of this type of IgG
molecule (Figure 5).
PPN_noCys_Red_140K
#
129-133
RT:
13.79-14.10
AV:
5
NL:
8.83E4
T:
FTMS+pESIFullms [1000.00-2700.00]
1151.5
1152.0
1152.5
1153.0
1153.5
1154.0
m/z
0
5
10
15
20
25
30
35
40
45
50
55
60
65
70
75
80
85
90
95
100
RelativeAbundance
1152.73
z=20
1152.78
z=20
1152.63
z=20
1152.83
z=20
1152.58
z=20
1152.93
z=20
1152.98
z=20
1152.53
z=20
1153.03
z=20
1152.48
z=20
1153.13
z=20
1151.98
z=20
1151.48
z=?
1152.38
z=20
1151.77
z=20
1153.53
z=?
1153.18
z=20
1153.68
z=? 1153.98
z=?
1154.32
z=?
+20 charged
Spectrum of a partially reduced light chain
(+20 charged)
Fab Heavy
24150
24160
24170
24180
m/z
47.93
24149.94
24150.94
24151.94
24152.95
24153.93
24154.97
24156.00
24163.90
24166.90
24169.92
tion =140 K
Monoisotopic Mass
200
400
600
800
1000
1200
1400
1600
m/z
0
25
50
75
100
RelativeAbundance
324.19
z=1
437.28
z=1
739.40
z=1
159.09
z=1
524.31
z=1
216.10
z=1
812.34
z=1
1175.91
z=9
409.28
z=1
1322.90
z=8
974.97
z=6
303.13
z=1
1076.53
z=4
839.48
z=3
703.74
z=3
1435.71
z=6
619.30
z=2
1512.03
z=7
1377.71
z=3
1751.88
z=5
High resolution top-down MS/MS
Full MS of light chain
m/z
800
900
1000
1100
1200
1300
1400
1500
1600
1700
1800
0
25
50
75
100
RelativeAbundance
1213.61
z=19
1281.03
z=18
1098.03
z=21
1048.16
z=22
1356.21
z=17
1152.93
z=20
1440.85
z=16
1536.97
z=15
1002.68
z=23
960.98
z=24
1646.75
z=14
922.62
z=?
1773.28
z=13
887.06
z=?
854.32
z=?
823.77
z=?
798.98
z=?
Six Individual isolation and fragmentationevents
One Orbitrap Detection event


