5
Thermo Scientific Poster Note
•
BioPharma_PN63944
_E 11/13S
Conclusion
In this study, a workflow
MS, fast chromatograph
to characterize intact m
confident amino acid se
following information for
•
Accurate measure
•
Reproducible quant
•
Confident amino ac
m a ProSwift RP-10R monolithic
SI-MS on the Q Exactive MS. As
ute as shown in (A). The average
ted complete charge envelope of
als five major glycosylation forms
e Protein Deconvolution software,
r the known amino acid sequence
found on mAbs. One such result
shown here). This indicates that the Q Exactive MS is a very powerful platform for
confirmation of protein primary structure.
Table 2. Relative abundance for the 5 most abundant glycoforms
For the top 5 glycoforms, the relative intensity reproducibility is within a few percent.
-7 ppm
G0F+G1F
0F
G0F+G2F (or 2G1F)
G1F+G2F
G2F+G2F
G1F+G2F+SA
m -8.5 ppm
-0.9 ppm
nown composition and mass
RAW file Q Exactive G0+G0F G0F+G0F G0F+G1F G0F+G2F G1F+G2F
1
1
12.9
74.1
100.0
67.0
23.4
2
1
12.0
72.8
100.0
66.2
22.0
3
1
12.2
75.0
100.0
67.0
23.6
4
2
12.7
75.7
100.0
63.6
21.6
5
2
13.2
75.4
100.0
64.8
21.0
6
2
12.9
76.6
100.0
64.7
21.6
CV
3.4% 1.6% N.A.
3.9% 4.4%
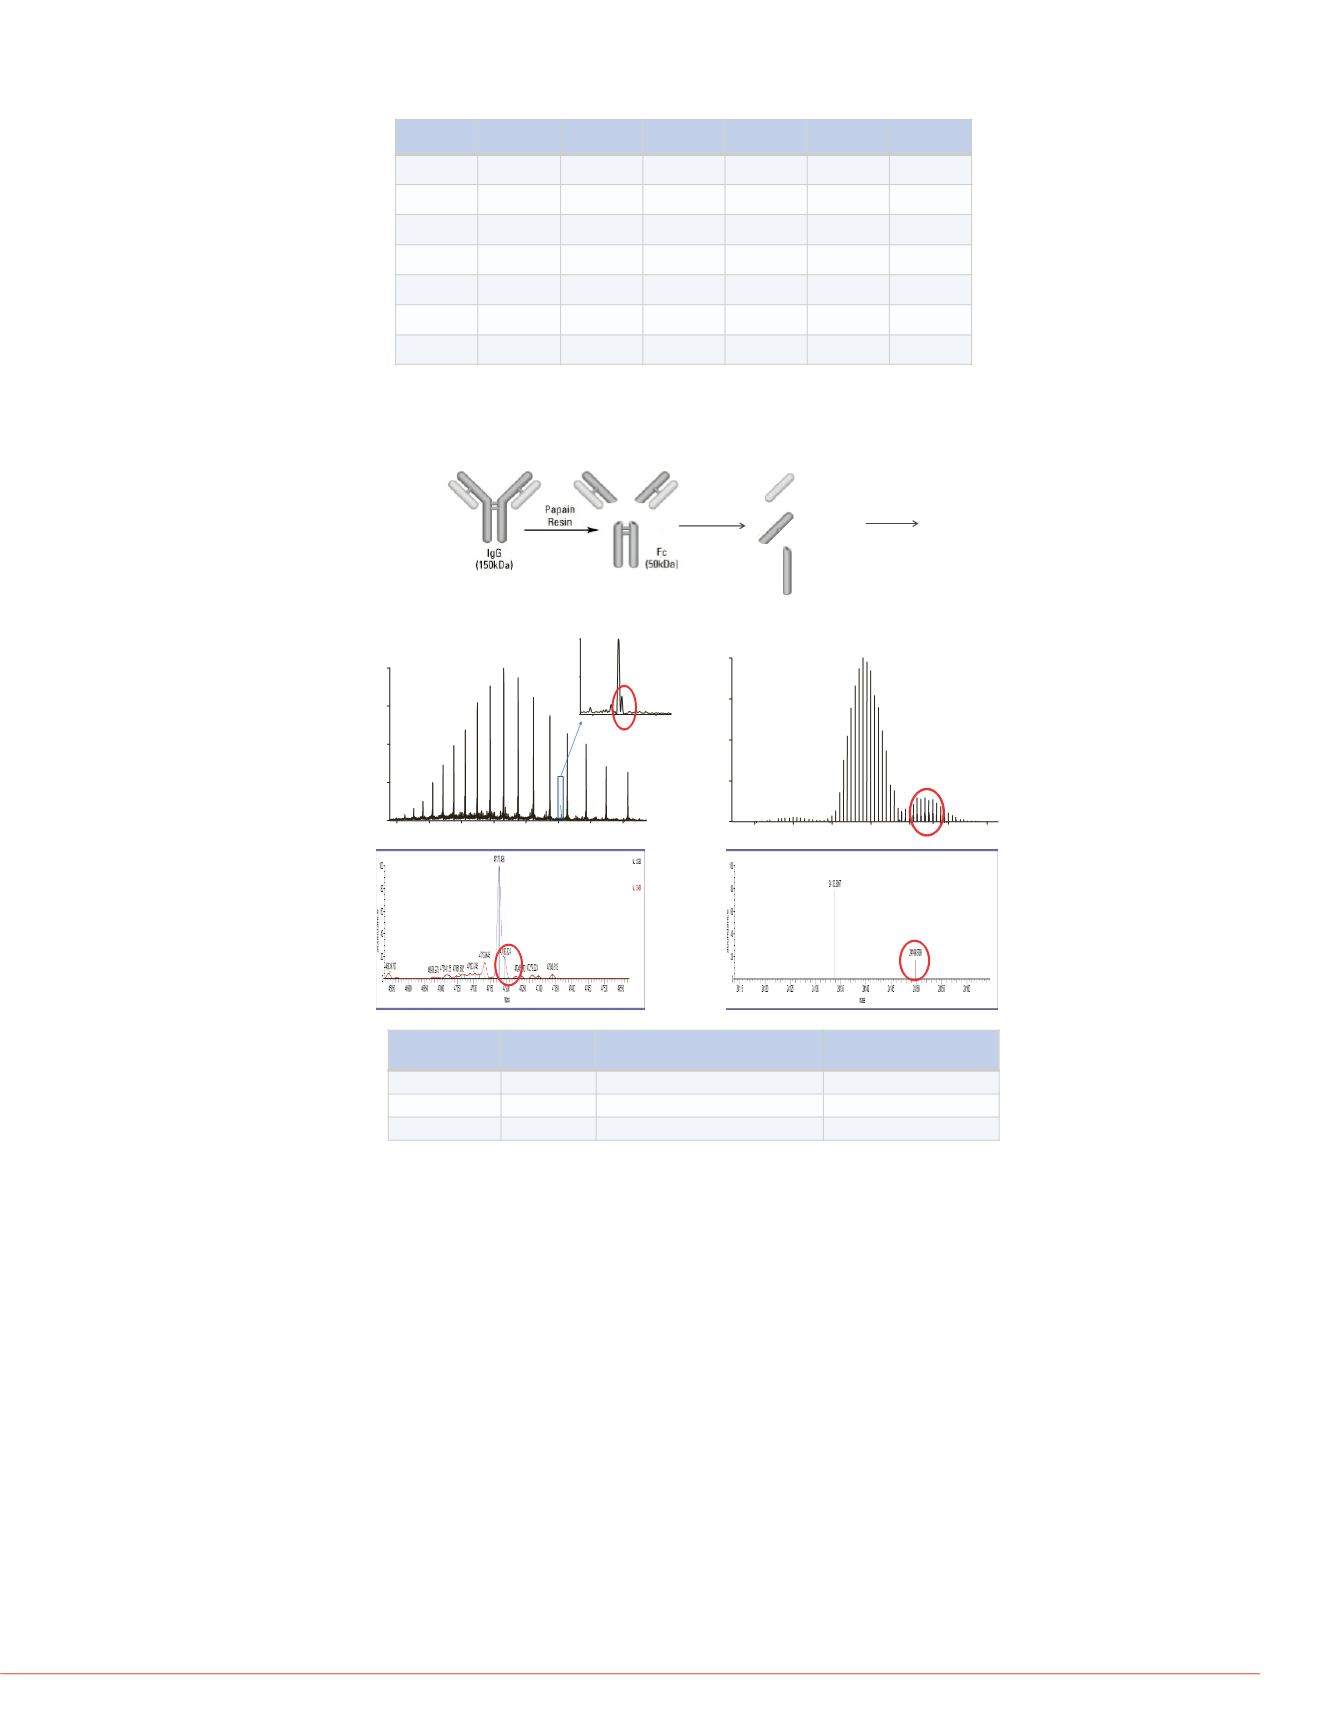
Reduction
IntactFab
Fablight
LCMS
Fabheavy
Fc
Figure 3: Identification of oxidation on intact Fab, light and Fab heavy chain
Sub-structure Resolution Delta Mass from non-oxidized
(Da)
Protein level mass error
(ppm)
Fab
17.5K
16.3
6.4
Fab heavy
140K
16.0158
0.7
Fab light
140K
16.0152
0.7
30% back
Lig
P Score
Figure 5: Top-down seq
Besides molecular mass, a
a top-down LC-MS/MS a
multiplexing mode where
different number of charge
ions were then detected all
than 30% of fragments fro
heavy chain (Figure 4 botto
Top-down sequencing was
less in molecular mass th
ProSight PC software mat
molecule (Figure 5).
Further characterization at substructure level is shown in Figure 3 to Figure 5. Fab
was generated using papain which cleaves this molecule at hinge. Fab was then
reduced to generate light chain and Fab heavy chain (Figure 3, top). LC/MS of intact
Fab, light chain and Fab heavy chain identified oxidation species as shown above
(Figure 3, middle). The mass errors of the identification at protein level were 6.4 ppm
at resolution 17,500 for Fab and less than 1 ppm at resolution 140,000 for light chain
and Fab heavy chain (Figure 3 bottom).
PPN_noCys_Red_140K
#
129-133
RT:
13.79-14.10
AV:
5
NL:
8.83E4
T:
FTMS+pESIFullms [1000.00-2700.00]
1151.5
1152.0
1152.5
1153.0
1153.5
m/z
0
5
10
15
20
25
30
35
40
45
50
55
60
65
70
75
80
85
90
95
100
RelativeAbundance
1152.73
z=20
1152.78
z=20
1152.63
z=20
1152.83
z=20
1152.58
z=20
1152.93
z=20
1152.98
z=20
1152.53
z=20
1153.03
z=20
1152.48
z=20
1153.13
z=20
1151.98
z=20
1151.48
z=?
1152.38
z=20
1151.77
z=20
1153.53
z=?
1153.18
z=20
11
+2
Spectrum of a partially re
(+20 charg
ReSpect is a trademar
the property of Ther
This information is n
manners that might in
3000
3200
3400
3600
907.2147
2965.3315
3025.8504
3088.8689
3154.5911
3223.1069
2820
2840
2860
2851.3306
5
2848.2716
2854.4543
2857.5893
06.5649
2F
+G2F
Oxidized Species of Fab
Relative Abundance
Fab Heavy
24120
24130
24140
24150
24160
24170
24180
m/z
0
25
50
75
100
24147.93
24146.94 24149.94
24145.91
24150.94
24151.94
24144.89
24152.95
24143.90
24153.93
24154.97
24156.00
24141.95
24163.90
24166.90
24140.89
24169.92
24138.85
Resolution =140 K
Monoisotopic Mass
Intact Fab
Resolution =17.5 K
1100
1200
1300
1400
1500
1600
1700
1800
m/z
0
25
50
75
100
RelativeAbundance
1430.63
1475.31
1388.57
1522.87
1348.92
1573.56
1311.49
1627.82
1685.91
1276.09
1242.53
1748.29
1815.54
1210.67
1180.47
1151.64
1609.46
1124.30
1654.55
1716.84
Average Mass
1518 1522 1526 1530
m/z
0
50
100
RelativeAbundance
1522.87
1517.50
1528.04
1532.30
1523.49
1521.46
200
400
6
0


