3
Thermo Scientific Poster Note
•
PN3078-1_e 05/12S
analysis
tific Dionex UltiMate
Thermo Scientific
e. The intact mass
spectrometer.
ion, size-exclusion
tact mass analysis
arvest cell culture
charge variants.
ical yields of more
fy and quantify MAb
terizes charge
sequent
Ab purity, aggregate
hromatography
onsists of a
tosampler capable of
cted onto the
d by the autosampler.
o Scientific MAbPac
AbPac SCX-10, 3 µm
ughput MAb variant
orter run time using
flow, we completed
one hour.
n were analyzed by
demonstrated the
filtered through a
0 mm, 0.8 ml
Dual Titanium System
ostated Column
(B)FC Analytical Dual-
avelength Detector
ivity Monitor.
L HCC using Thermo
protein concentration
fied IgG was injected
ed via pH gradient
ris, 11 mM imidazole,
8 (Buffer B). The
n, a linear gradient
onto a 96-wellplate at
Results
In the first step of the chromatographic
Protein A Affinity column. In order to c
2
D analysis, 50 µL of HCC was injecte
96-wellplate using time-based triggers
0.1 min. At 2 mL/min flow rate, the tota
CDS software is capable of fraction col
time and peak triggers together. In the
0.1 min delay time in fraction collection
A transition sequence was used to swit
2
D analysis column. The
2
D analyses c
Collected fractions can be directly inje
modifications. The injection volume for
The IEC analysis of the Protein-A purifi
revealed many variants in the purified I
digestion (data not shown) eliminated
suggesting the presence of lysine vari
reduced the analysis time from ~60 to
chromatographic steps was <60 min,
between different analyses. All these s
HCC samples can be cycled through
Over the last few years, researchers h
is an effective method to separate acid
pH gradient to the separate MAb varia
Figure 5, separation of at least three v
eluted at 19.8, 20.8, and 22.1 min, res
time monitoring of the pH and conducti
pH values for fractions containing Pea
respectively. These fractions were ana
(Figure 6). On-line desalting using a re
out prior to MS detection. The deconv
component in Peak 1 has a 147992.70
148315.903
m/z
correspond to differen
The major component in Peak 2 has a
Peak 1 and Peak 2 is 128 amu, corres
mass between Peak 2 and Peak 3 (at
suggest that Peak 1 and Peak 2 corre
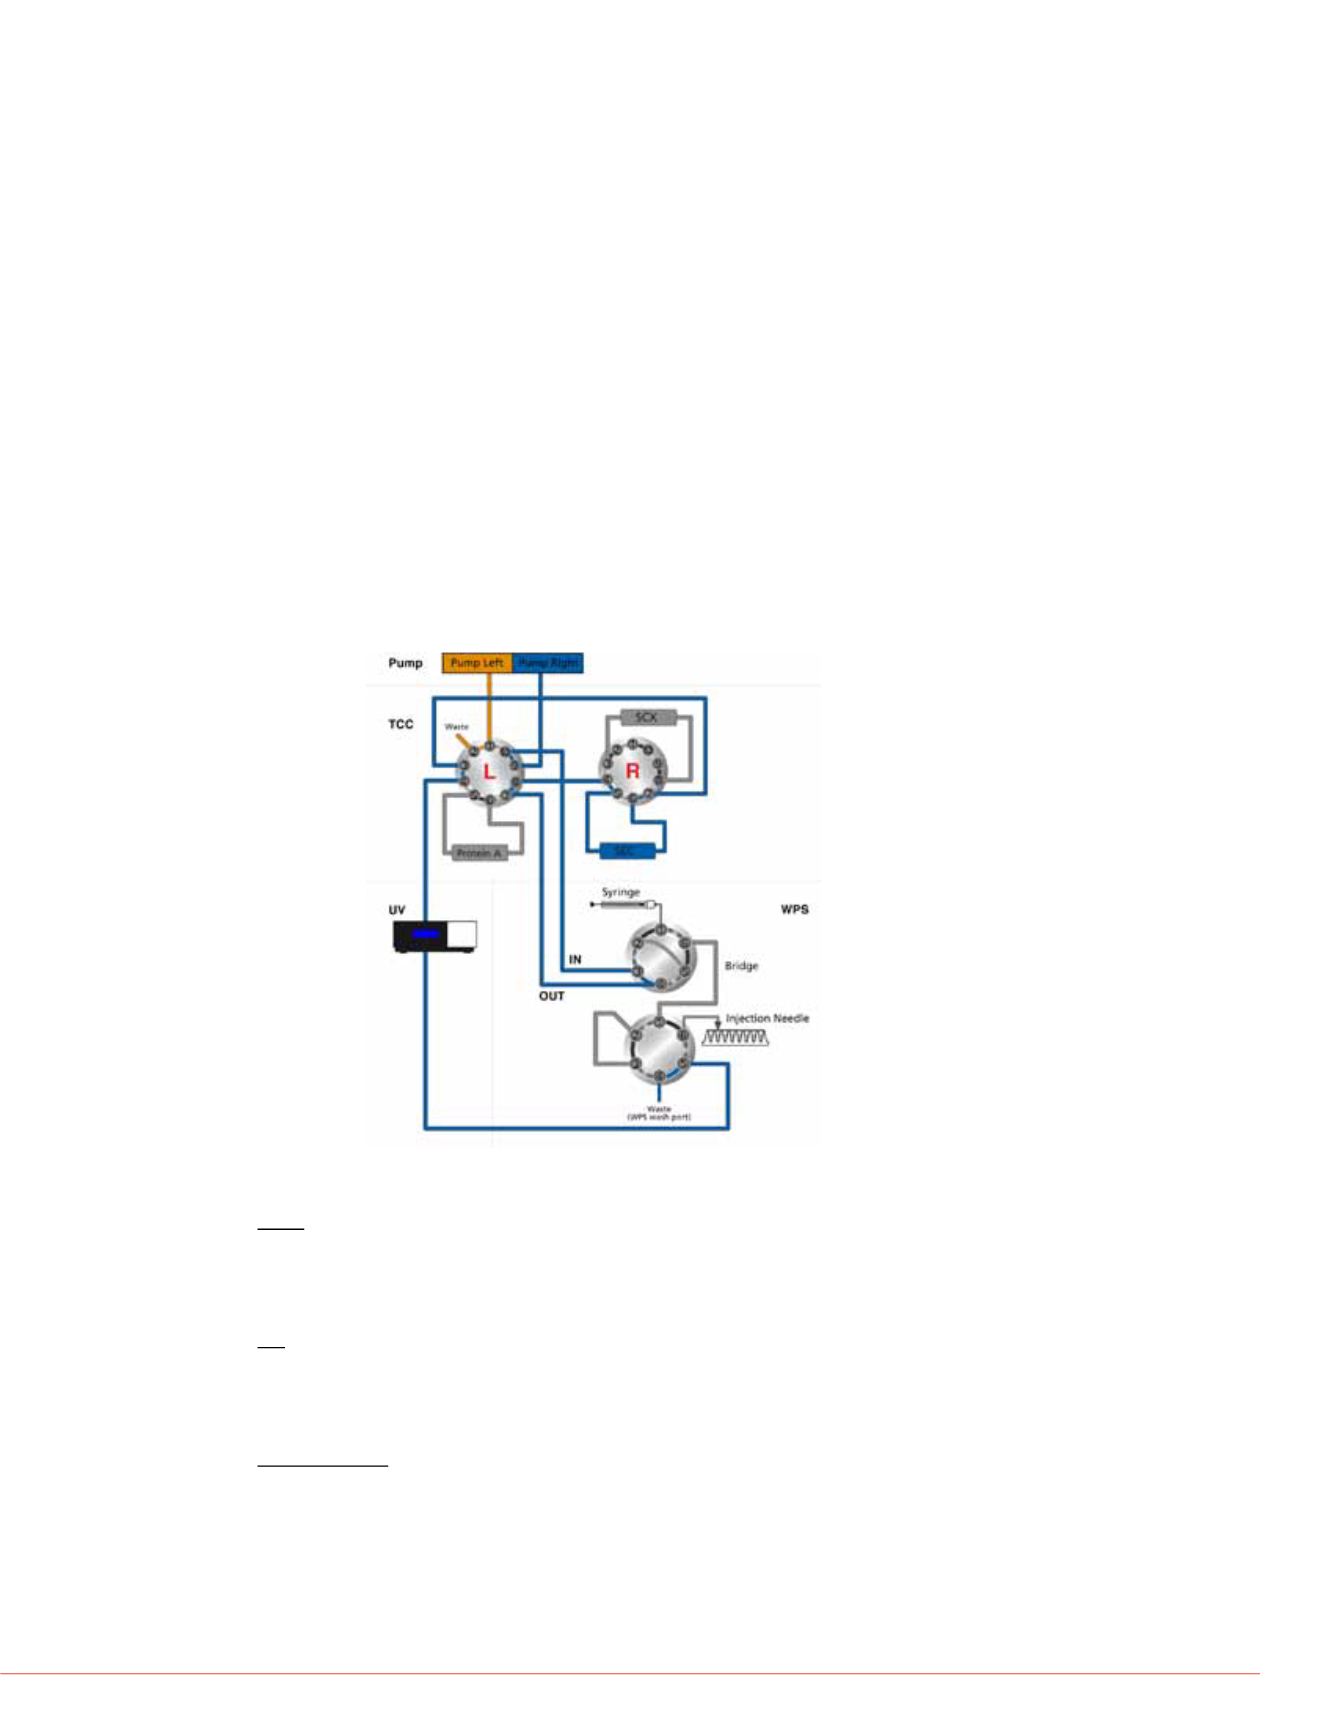
FIGURE 1. Fluidic configuration of the automated off-line 2D-LC system using
the wellplate bio-inert autosampler
2D-LC Workflow
The workflow and LC conditions for automated off-line 2D-LC include the following:
§
Injection of 50 µL of an unpurified HCC sample
§
A first-dimension (
1
D ) affinity chromatography separation at a flow rate of
2.0 mL/min using the following steps:
–
A column wash/equilibration step of 0.75 min
–
An elution step of 1 min
–
Automated time-based fraction collection into a wellplate in the autosampler
–
Protein A column is regenerated by a 20% acetonitrile wash and reconditioned
for the next analysis
Total analysis time is approximately 3 min.
§
A second-dimension (
2
D) separation of the collected fraction includes one of the
following:
–
SEC separation at a flow rate of 0.3 mL/min using an isocratic mobile phase
–
Strong cation-exchange separation at a flow rate of 0.6 mL/min using a salt
gradient
FIGURE 2. Example of a
1
D affinity p
yellow stripe indicates fractionation
0.00
0.20
0.40
0.60
0.80
1.00
1.20
-20
125
250
375
500
625
750
875
1,000
1,125
1,250
1,375
1,500
mAU
Flow:2.000 ml/min
%B-ProtA, elute: 0.0 %
100.0
%C-ProtA, reequilibrate: 0.0%
1- Void-0.351
Protein AAffinity Separation Conditions:
Column:AB Poros
®
A 20 µm, 4.6 × 50 mm
Mobile PhaseA: 50 mM NaH
2
PO
4
, 150 mM Na
Mobile Phase B: 50 mM NaH
2
PO
4
, 150 mM Na
Mobile Phase C: Acetonitrile
Gradient:
Wash and equilibration step for 0.
followed by 1 min elution step at 1
followed by 0.5 min regeneration s
Flow Rate: 2.0 mL/min
Temperature: 30
°
C
LC-MS
HPLC: Thermo Scientific ProSwift RP-10R Monolithic Capillary Column
(1.0 mm i.d. × 5 cm) was used for desalting. LC solvents were 0.1% formic acid in H
2
O
(Solvent A) and 0.1% formic acid in acetonitrile (Solvent B). Column was heated to 50
ºC during analysis. Flow rate was 100 µL/min. After injection of MAb, a 5 min gradient
from 10% B to 95% B was used to elute MAbs from the column.
MS: Using Q Exactive
™
instruments, intact MAb was analyzed by ESI-MS for intact
molecular mass. The spray voltage was 4 kV. Sheath gas flow rate was set at 10.
Auxiliary gas flow rate was set at 5. Capillary temperature was 275 ºC . S-lens level
was set at 55. In-source CID was set at 45 eV. Resolution was 17,500. The AGC
target was set at 3E6 for full scan. Maximum IT was set at 200 ms.
Data Processing: Full MS spectra of intact MAbs were analyzed using Thermo
Scientific Protein Deconvolution software 1.0 that utilizes the ReSpect algorithm for
molecular mass determination. Mass spectra for deconvolution were produced by
averaging spectra across the most abundant portion of the elution profile for the MAb.
The averaged spectra were subsequently deconvoluted using an input
m/z
range of
2000 to 4000
m/z
, an output mass range of 140000 to 160000 Da, a target mass of
150000 Da, and minimum of at least 8 consecutive charge states from the input
m/z
spectrum to produce a deconvoluted peak.


