4
Automated MAb Workflow: from Harvest Cell Culture to Intact Mass Analysis of Variants
Results
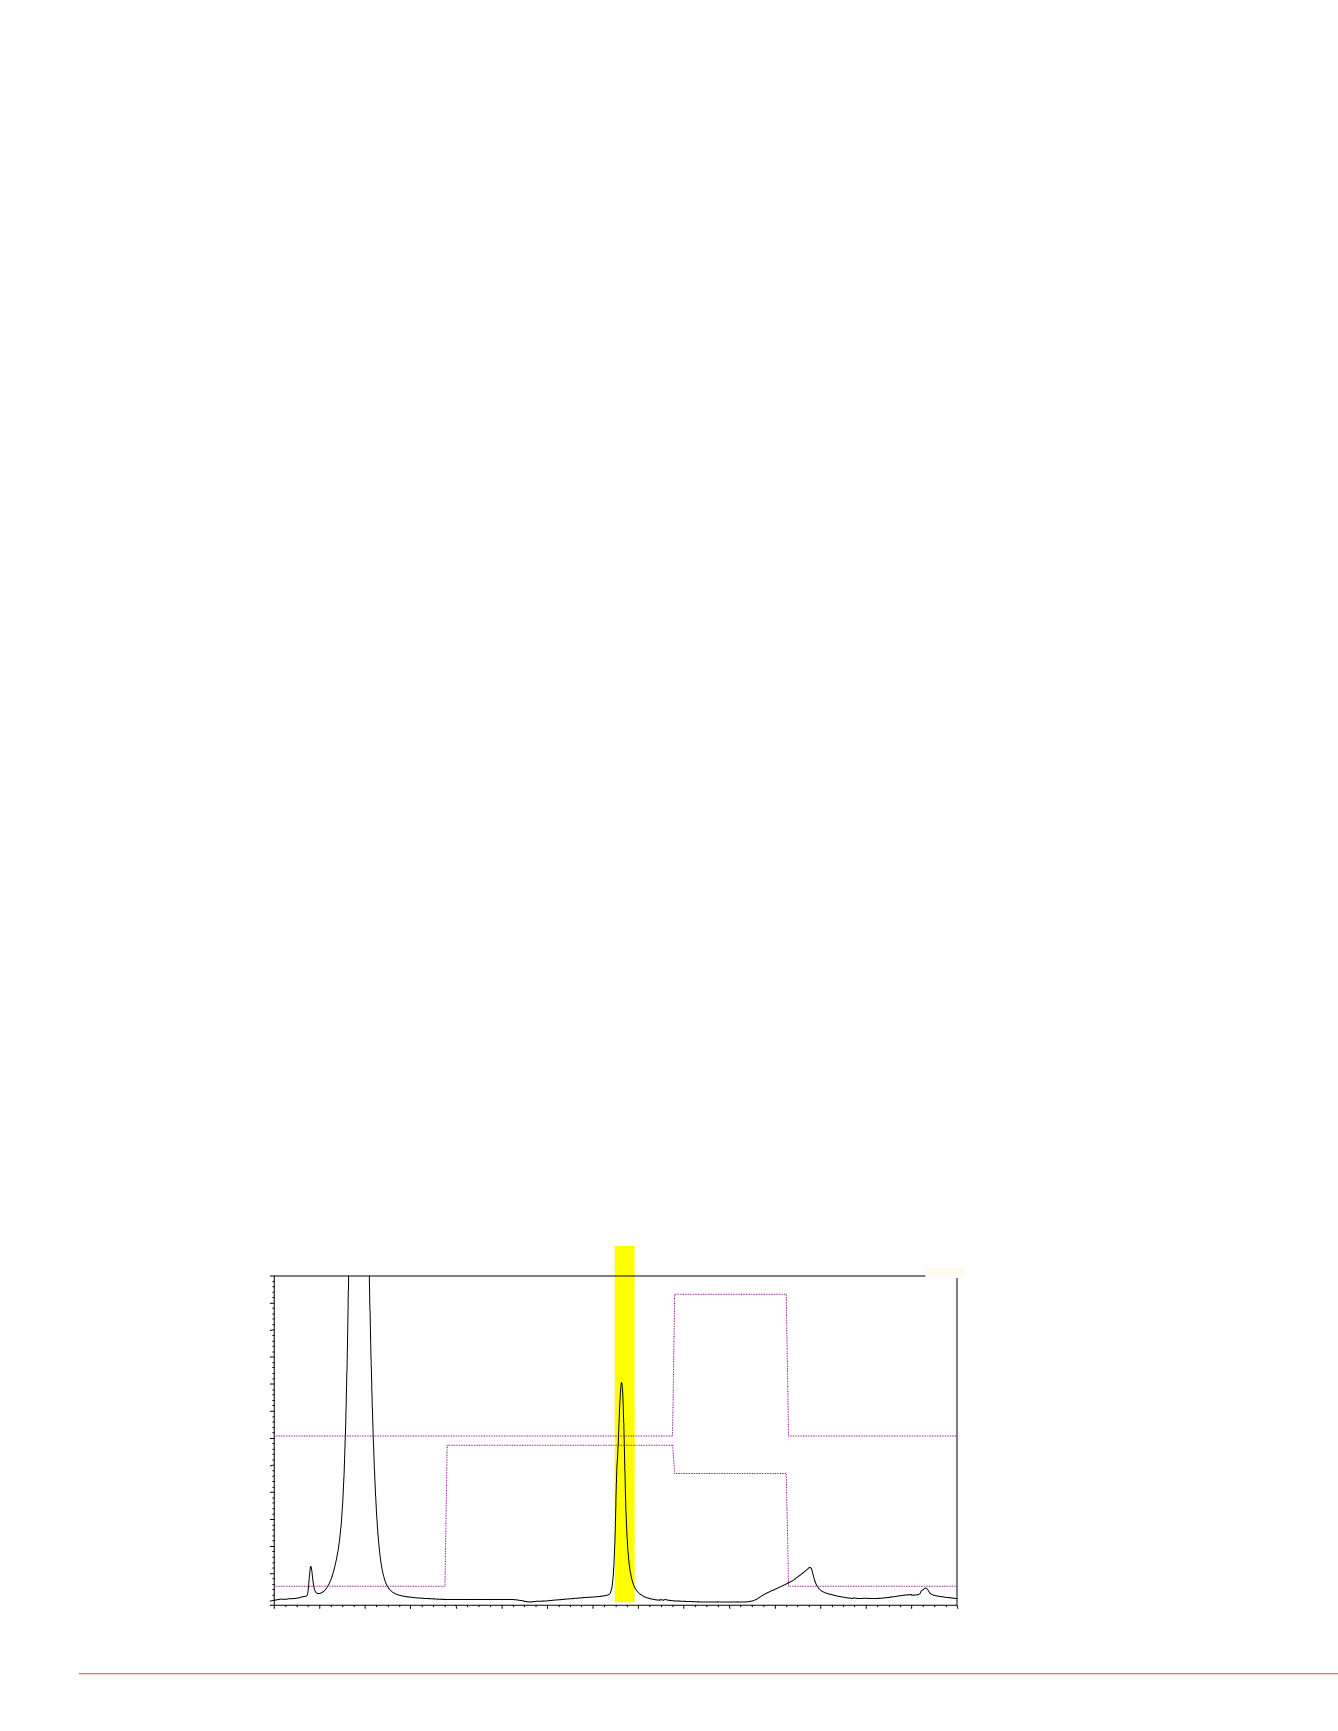
In the first step of the chromatographic separation, HCC was injected onto the
Protein A Affinity column. In order to collect sufficient amounts of IgG material for the
2
D analysis, 50 µL of HCC was injected. The IgG fraction was collected into a
96-wellplate using time-based triggers (Figure 2). The total collection time was
0.1 min. At 2 mL/min flow rate, the total volume collected was 200 µL. Chromeleon
CDS software is capable of fraction collection using UV-based peak triggers, or both
time and peak triggers together. In the configuration presented here, there was a
0.1 min delay time in fraction collection.
A transition sequence was used to switch the valves and direct the flow path to each
2
D analysis column. The
2
D analyses can be either SEC (Figure 3) or IEC (Figure 4).
Collected fractions can be directly injected onto the
2
D column without further
modifications. The injection volume for each
2
D was 25 µL.
The IEC analysis of the Protein-A purified fractions which used a linear salt gradient
revealed many variants in the purified IgG fractions. A one-hour carboxypeptidase
digestion (data not shown) eliminated several peaks and enhanced others,
suggesting the presence of lysine variants. Use of the MAbPac SCX-10 3 µm column
reduced the analysis time from ~60 to 20 min. The total analysis time for all three
chromatographic steps was <60 min, which included the transition programs
between different analyses. All these steps are automated, and therefore multiple
HCC samples can be cycled through without user intervention.
Over the last few years, researchers have demonstrated that pH-gradient-based IEC
is an effective method to separate acidic and basic proteins. In this study, we applied
pH gradient to the separate MAb variants on a MAbPac SCX-10 column. As shown in
Figure 5, separation of at least three variants was achieved. Major peaks 1, 2, and 3
eluted at 19.8, 20.8, and 22.1 min, respectively. Use of the PCM-3000 allowed real-
time monitoring of the pH and conductivity of the eluent during all the analyses. The
pH values for fractions containing Peaks 1, 2, and 3 were 8.5, 8.6, and 8.7,
respectively. These fractions were analyzed on a Q Exactive mass spectrometer
(Figure 6). On-line desalting using a reversed phase monolithic column was carried
out prior to MS detection. The deconvoluted spectra (Figure 7) showed that the major
component in Peak 1 has a 147992.703
m/z
. Adjacent peaks at 148155.503 and
148315.903
m/z
correspond to different glycoforms with 1 and 2 additional hexoses.
The major component in Peak 2 has a 148210.650
m/z
. The delta mass between
Peak 1 and Peak 2 is 128 amu, corresponding to one lysine. Similarly, the delta
mass between Peak 2 and Peak 3 (at
m/z
148248.641) is also 128 amu. These data
suggest that Peak 1 and Peak 2 correspond to lysine truncation variants of Peak 3.
C system using
FIGURE 4. Example of a
2
D SCX separ
from the MAbPac SCX-10, 3 µm, 4 × 5
de the following:
ow rate of
he autosampler
and reconditioned
ludes one of the
ic mobile phase
in using a salt
FIGURE 3. Example of an isocratic
2
collected from the MAbPac SEC-1, 4
FIGURE 2. Example of a
1
D affinity purification of IgG from HCC: the vertical
yellow stripe indicates fractionation time.
0.00
0.20
0.40
0.60
0.80
1.00
1.20
1.40
1.60
1.80
2.00
2.20
2.40
2.60
2.80
3.00
-20
125
250
375
500
625
750
875
1,000
1,125
1,250
1,375
1,500
UV_VIS_1
mAU
min
WVL:280 nm
Flow:2.000 ml/min
%B-ProtA, elute: 0.0 %
100.0
80.0
0.0
%C-ProtA, reequilibrate: 0.0%
20.0
0.0
1- Void-0.351
2- IgG-1.525
GA1
Protein AAffinity Separation Conditions:
Column:AB Poros
®
A 20 µm, 4.6 × 50 mm
Mobile PhaseA: 50 mM NaH
2
PO
4
, 150 mM NaCl, pH 7.5
Mobile Phase B: 50 mM NaH
2
PO
4
, 150 mM NaCl,pH 2.5
Mobile Phase C: Acetonitrile
Gradient:
Wash and equilibration step for 0.75 min at 100% A,
followed by 1 min elution step at 100% B,
followed by 0.5 min regeneration step at 80% B and 20% C
Flow Rate: 2.0 mL/min
Temperature: 30
°
C
0.0
1.0
2.0
3.0
4.0
5.0
6.0
-5.0
0.0
5.0
10.0
15.0
20.0
25.0
30.0
35.0
40.0
45.0
50.0 mAU
SEC Conditions:
Column: MAbPac SEC-1, 4 × 300 mm
Mobile Phase:50 mM NaH
2
PO
4
, 300 mM NaCl
Flow Rate: 0.3 mL/min
Temperature: 30
°
C
0.0
1.0
2.0
3.0
4.0
5.0
6.0
7.0
8.0
-1.00
0.00
1.00
2.00
3.00
4.00
5.00
6.00 mAU
Flow:0.600 ml/min
%B IEC high salt:10.0 %
%C:0.0%
SCX Conditions:
Column: MAbPac SCX-10, 3 µm, 4 × 50 mm
Mobile PhaseA: 20 mM MES, 60 mM NaCl,
Mobile Phase B: 20 mM MES, 300 mM NaCl
Gradient:
linear increase from10 % B to
1 min high salt wash at 100% B
3 min re-equilibration step at 1
Flow Rate: 0.6 mL/min
Temperature: 30
°
C
lumn
formic acid in H
2
O
n was heated to 50
b, a 5 min gradient
SI-MS for intact
was set at 10.
ºC . S-lens level
500. The AGC
.
ing Thermo
ect algorithm for
re produced by
profile for the MAb.
put
m/z
range of
a target mass of
rom the input
m/z
pH-GradientSeparation Conditions:
Column: MAbPac SCX-10, 10 µm, 4 × 250 mm
Mobile PhaseA: 9.6 mM Tris, 11 mM imidazole, a
Mobile Phase B: 9.6 mM Tris, 11 mM imidazole,
Gradient:
3 min pre-equilibration at 40% B
followed by linear increase from40
followed by 7 min high pH wash at
followed by 15 min re-equilibration
Flow Rate: 1.0 mL/min
Temperature: 30
°
C
Fraction Collection Rate: 0.2 min/well
15.0
16.0
17.0
18.0
19.0
20.0
21.0
-5.0
0.0
5.0
10.0
15.0
20.0
25.0
30.0
35.0
40.0
45.0
50.0 mAU
64%B
1
FIGURE 5. pH gradient separation of


