4
C-MS Workflow Solution for Comprehensive
tion
ndreas FR Huhmer
1
and Patrick K Bennett
1
stitute, Northeastern University, Boston, MA
To measure the mass accuracy and reproducibility of mAb samples on the Q Exactive
MS in conjunction with Protein Deconvolution software, the mAb sample was analyzed
several times using two different instruments over three different days. The results for
ppm mass accuracy are shown in Table 1 and the results for relative abundance of the
various glycoforms are shown in Table 2.
Table 1: ppm mass deviations from expected target masses for the 5 most
abundant glycoforms
The average ppm error for all 34 measurements of four different mAbs on multiple
instruments was
6.9 ppm
with a standard deviation of
6.4 ppm
(not all the data are
shown here). This indicates that the Q Exactive MS is a very powerful platform for
confirmation of protein primary structure.
Table 2. Relative abundance for the 5 most abundant glycoforms
For the top 5 glycoforms, the relative intensity reproducibility is within a few percent.
RAW file Q Exactive G0+G0F G0F+G0F G0F+G1F G0F+G2F G1F+G2F
1
1
-10.5
0.7
-10.5
-13.8
-18.0
2
1
-11.6
-1.1
-8.8
-11.2
-12.0
3
1
5.1
-5.0
-2.6
5.1
5.6
4
2
-14.3
3.0
-6.9
-5.4
-5.9
5
2
-8.6
-2.2
-12.2
-12.5
-12.9
6
2
-14.3
-6.6
-12.3
-14.8
-10.1
RAW file Q Exactive G0+G0F G0F+G0F G0F+G1F G0F+G2F G1F+G2F
1
1
12.9
74.1
100.0
67.0
23.4
2
1
12.0
72.8
100.0
66.2
22.0
3
1
12.2
75.0
100.0
67.0
23.6
4
2
12.7
75.7
100.0
63.6
21.6
5
2
13.2
75.4
100.0
64.8
21.0
6
2
12.9
76.6
100.0
64.7
21.6
CV
3.4% 1.6% N.A.
3.9% 4.4%
IntactFab
Figure 3: Identification of oxidation on intact Fab, light and Fab heavy chain
30% bac
Li
P Scor
Figure 4: Top-down s
Besides molecular mass,
a top-down LC-MS/MS
multiplexing mode where
different number of charg
ions were then detected
than 30% of fragments fr
heavy chain (Figure 4 bott
oluted peak. To identify glycoforms,
s with the various combinations of
HCD spectra were analyzed using
a fragment ion tolerance of 5 ppm.
9
10
11
12
13
14
00
3000
3200
3400
3600
851.3306
2907.2147
2965.3315
3025.8504
3088.8689
3154.5911
3223.1069
2820
2840
2860
2851.3306
205
2848.2716
2854.4543
2857.5893
2806.5649
Total Ion Chromatogram
Average Spectrum of
Intact mAb Charge Envelope
G2F
1F+G2F
200
400
0
25
50
75
100
RelativeAbundance
324.19
z=1
437.28
z=1
159.09
z=1
524.31
z=1
216.10
z=1
409.28
z=1
303.13
z=1
H
800
900
1000
0
25
50
75
100
RelativeAbundance
1002.68
z=23
960.98
z=24
922.62
z=?
887.06
z=?
854.32
z=?
823.77
z=?
798.98
z=?
o reduce intact mAb, the sample was
nidine-HCl containing 5 mM DTT for
enerated using papain in 1mM EDTA,
7.0. Before digestion, the enzyme
°C in the same buffer at an enzyme:
37 °C overnight using an enzyme:
nolithic column (1 x 50mm) was used
chain. LC solvents were 0.1% formic
tonitrile (Solvent B). The column was
0 µL/min. After injection of 1 µg mAb,
olumn (0.0 min, 20% B; 1.0 min, 35%
.1 min, 20% B; 15.0 min, 20% B).
sed for this study. Intact and reduced
ular mass. Top-down MS/MS was
with a unique spectrum multiplexing
ragment ions produced from several
ent charge state of the reduced mAb,
rbitrap™
mass analyzer. The spray
. Auxiliary gas flow rate was set at 5.
et at 55. In-source CID was set at 45
mAb and intact Fab average mass
b heavy chain monoisotopic mass
-down MS/MS. The AGC target was
IT was set at 250 ms.
ing Prot in Deconv lution software
ass det rmination. Mass spectra for
c oss the most abundant portion of
8 consecutive charge states from the
One microgram of mAb was desalted and eluted from a ProSwift RP-10R monolithic
column using a 15 min gradient and analyzed using ESI-MS on the Q Exactive MS. As
shown in Figure 1, the mAb was eluted over one minute as shown in (A). The average
spectrum over the elution time shows a nicely distributed complete charge envelope of
the mAb (B). A zoom-in view of each charge state reveals five major glycosylation forms
that are baseline separated (C).
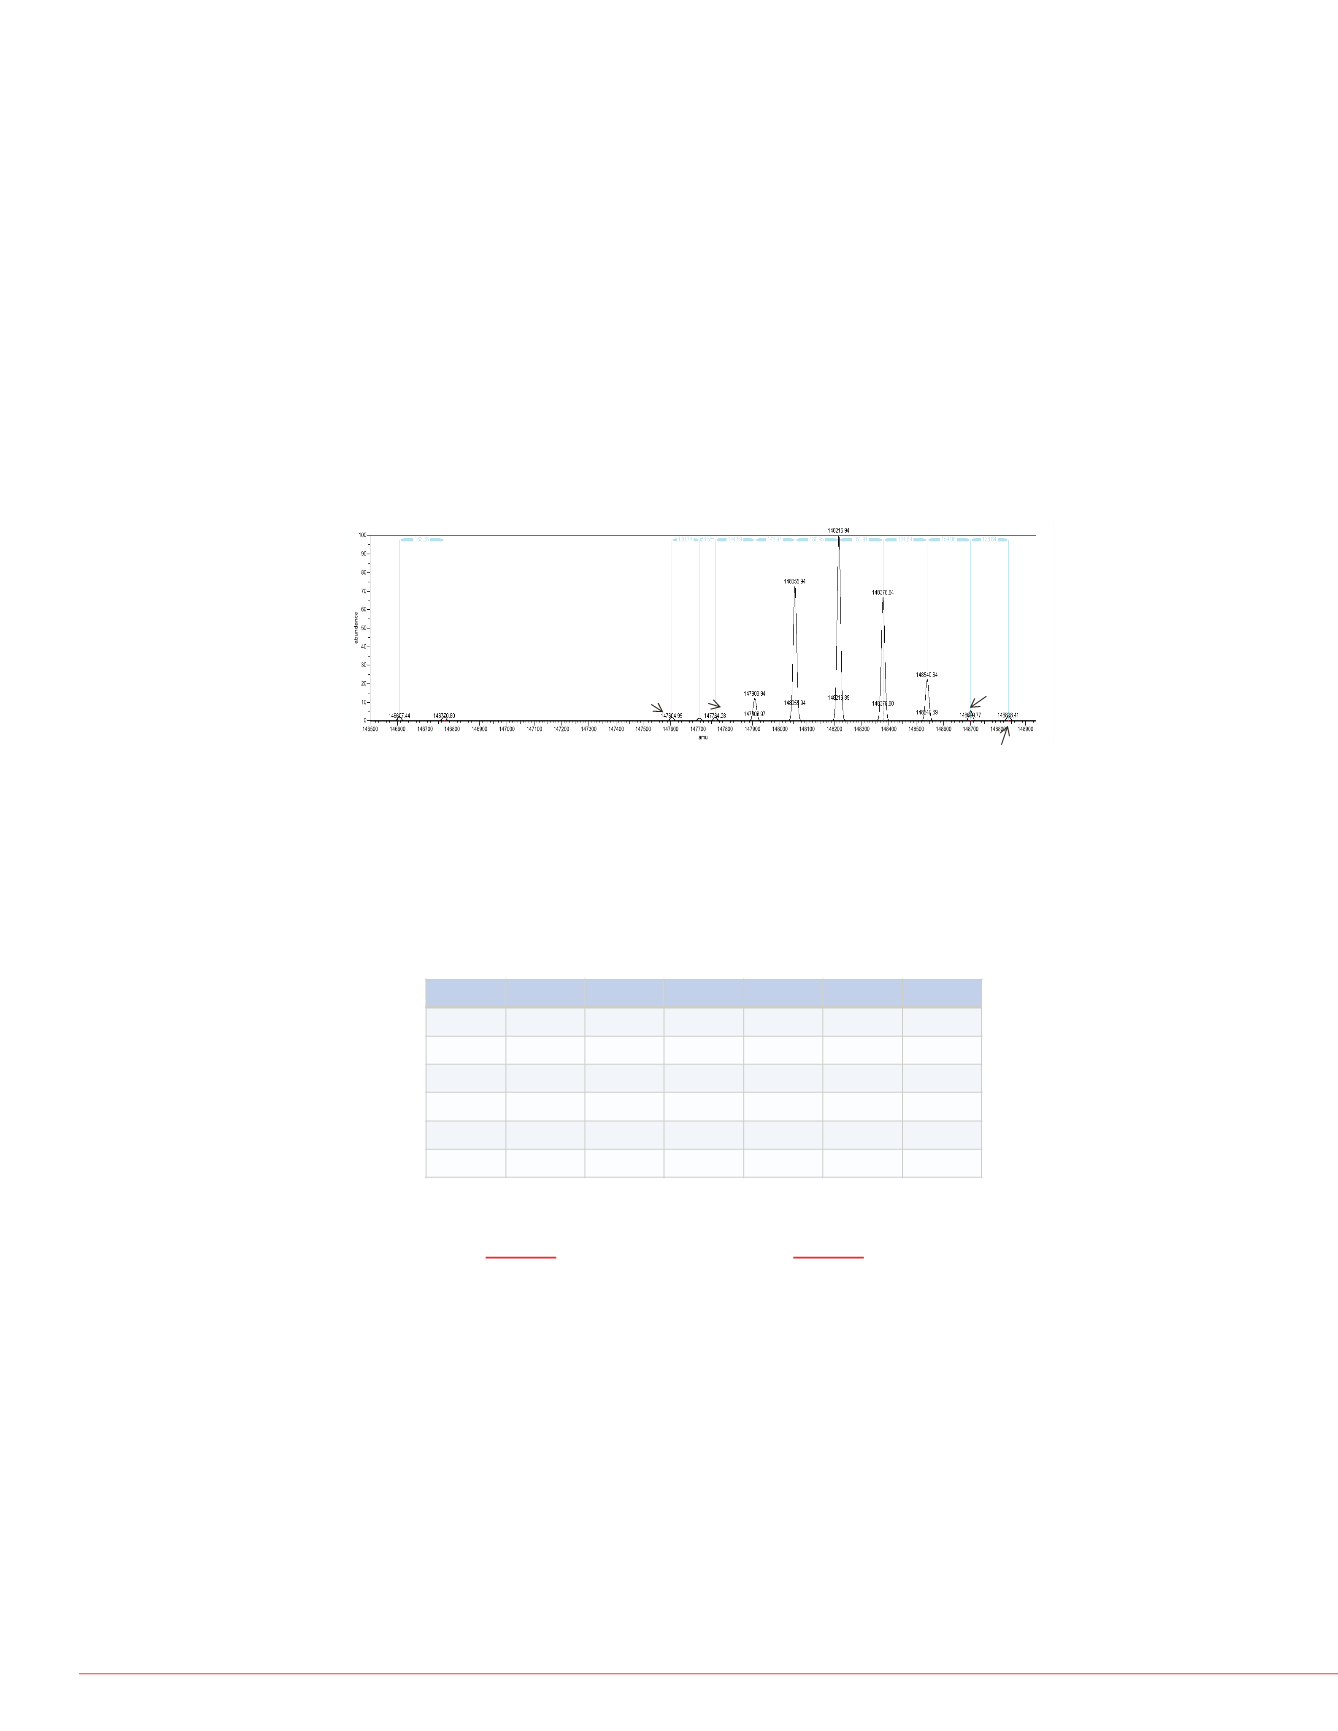
After each of the mAb datasets were analyzed using the Protein Deconvolution software,
the masses were compared to the masses expected for the known amino acid sequence
with the various combinations of glycoforms commonly found on mAbs. One such result
is shown below in Figure 2.
-7 ppm
G0F+G1F
G0F+G0F
G0F+G2F (or 2G1F)
G1F+G2F
G2F+G2F
G0+G0F
G0+G0
2xMan5
G1F+G2F+SA
5.0 ppm
-0.7 ppm -8.5 ppm
-0.9 ppm
Figure 2: Deconvoluted spectrum for a mAb with known composition and mass
errors of average molecular mass
Figure 3: Identification
Sub-structure Re
Fab
Fab heavy
Fab light
Further characterizati
was generated using
reduced to generate li
Fab, light chain and
(Figure 3, middle). Th
at resolution 17,500 f
and Fab heavy chain (
Intact Fab
Resolution
1100
1200
1300
1400
1500
m/z
0
25
50
75
100
RelativeAbundance
1430.63
1475.31
1388.57
1522
1348.92
1311.49
1276.09
1242.53
1210.67
1180.47
1151.64
1124.30
Average Mass


