2
Top-Down Analysis of Intact Antibodies Using Orbitrap Mass Spectrometry
Results
Orbitrap MS Analysis o
In contrast to electrospra
Overview
Purpose:
Perform top-down analysis of intact antibodies in native and denatured
forms using Thermo Scientific™ Orbitrap™ mass spectrometry
observed charge states r
is spread over only a few
glycoforms of the antibod
assignment. For exampl
G0F oligosaccharidic cha
Methods:
Orbitrap MS and MS/MS (HCD, ETD, and EThcD) analysis of intact
Herceptin IgG monoclonal antibody
Results:
Demonstrated the ability of Orbitrap instrumentation to perform top-down
analysis of intact antibodies in native and denatured forms
can be assigned to G0/G
G2F/G2F glycoforms (Fi
Introduction
Therapeutic monoclonal antibodies (mAbs) have gained considerable importance over
the past years due to their use to treat cancer and autoimmune diseases. Mass
t
t
l
i
ifi
t l
th l ti l t l
d f th l i
f
spec rome ry p ays a s gn can ro e among e ana y ca oo s use or e ana ys s o
therapeutic mAbs, being able to provide valuable information on antibody properties
such as intact mass, amino acid sequence, disulfide bridges, and post-translational
modifications (PTMs) including glycosylation. Usually mass spectrometric analysis is
performed at the peptide level, which requires several sample preparation steps prior
to analysis including denaturation reduction alkylation digestion and release of
FIGURE 2. Orbitrap ma
native forms. Spectra w
modified Q Exactive an
,
,
,
,
,
glycan chains. Here we present a more straightforward, top-down approach that uses
recent advances in Orbitrap mass spectrometry for the analysis of intact mAbs in
native and denatured forms.
Methods
60
70
80
90
100
ndance
315
3088.
3025.8
2965 343
ded
Sample Preparation
Herceptin
®
(trastuzumab) IgG mAb from Genentech (Figure 1) was buffer exchanged
prior to mass spectrometric analysis into 100mM ammonium acetate using Micro Bio-
0
10
20
30
40
50
Relative Abu
.
2907.266
2851.409
2797.570
2695.873
2601.420
unfol
Spin™ 6 columns (Bio-Rad). The antibody solution was analyzed at a concentration of
10μM in either 100mM aqueous ammonium acetate or in a mixture of
acetonitrile:water, 1:1 with 0.1% FA.
Mass Spectrometry
T d
l i
f th i t t tib d
i d t
difi d Th
2000
2500
ractions
70
80
90
100
nce
op- own ana ys s o e n ac an o y was carr e ou on mo e ermo
Scientific™ Exactive™ Plus, Thermo Scientific™ Q Exactive™, and Thermo
Scientific™ Orbitrap Elite™ instruments in direct infusion electrospray or static
nanospray mode. Higher-energy collision dissociation (HCD) was employed for the
first two instruments, and electron transfer dissociation (ETD), HCD, and electron
transfer higher energy collision dissociation (EThcD) were used on a modified Orbitrap
folded,
n-covalent inte
20
30
40
50
60
Relative Abunda
-
Elite instrument.
Data Analysis
Data analysis was performed using Thermo Scientific™ Protein Deconvolution™ 2.0
software and ProSightPC™ 2 0 software
no
2000 3000 4000
0
10
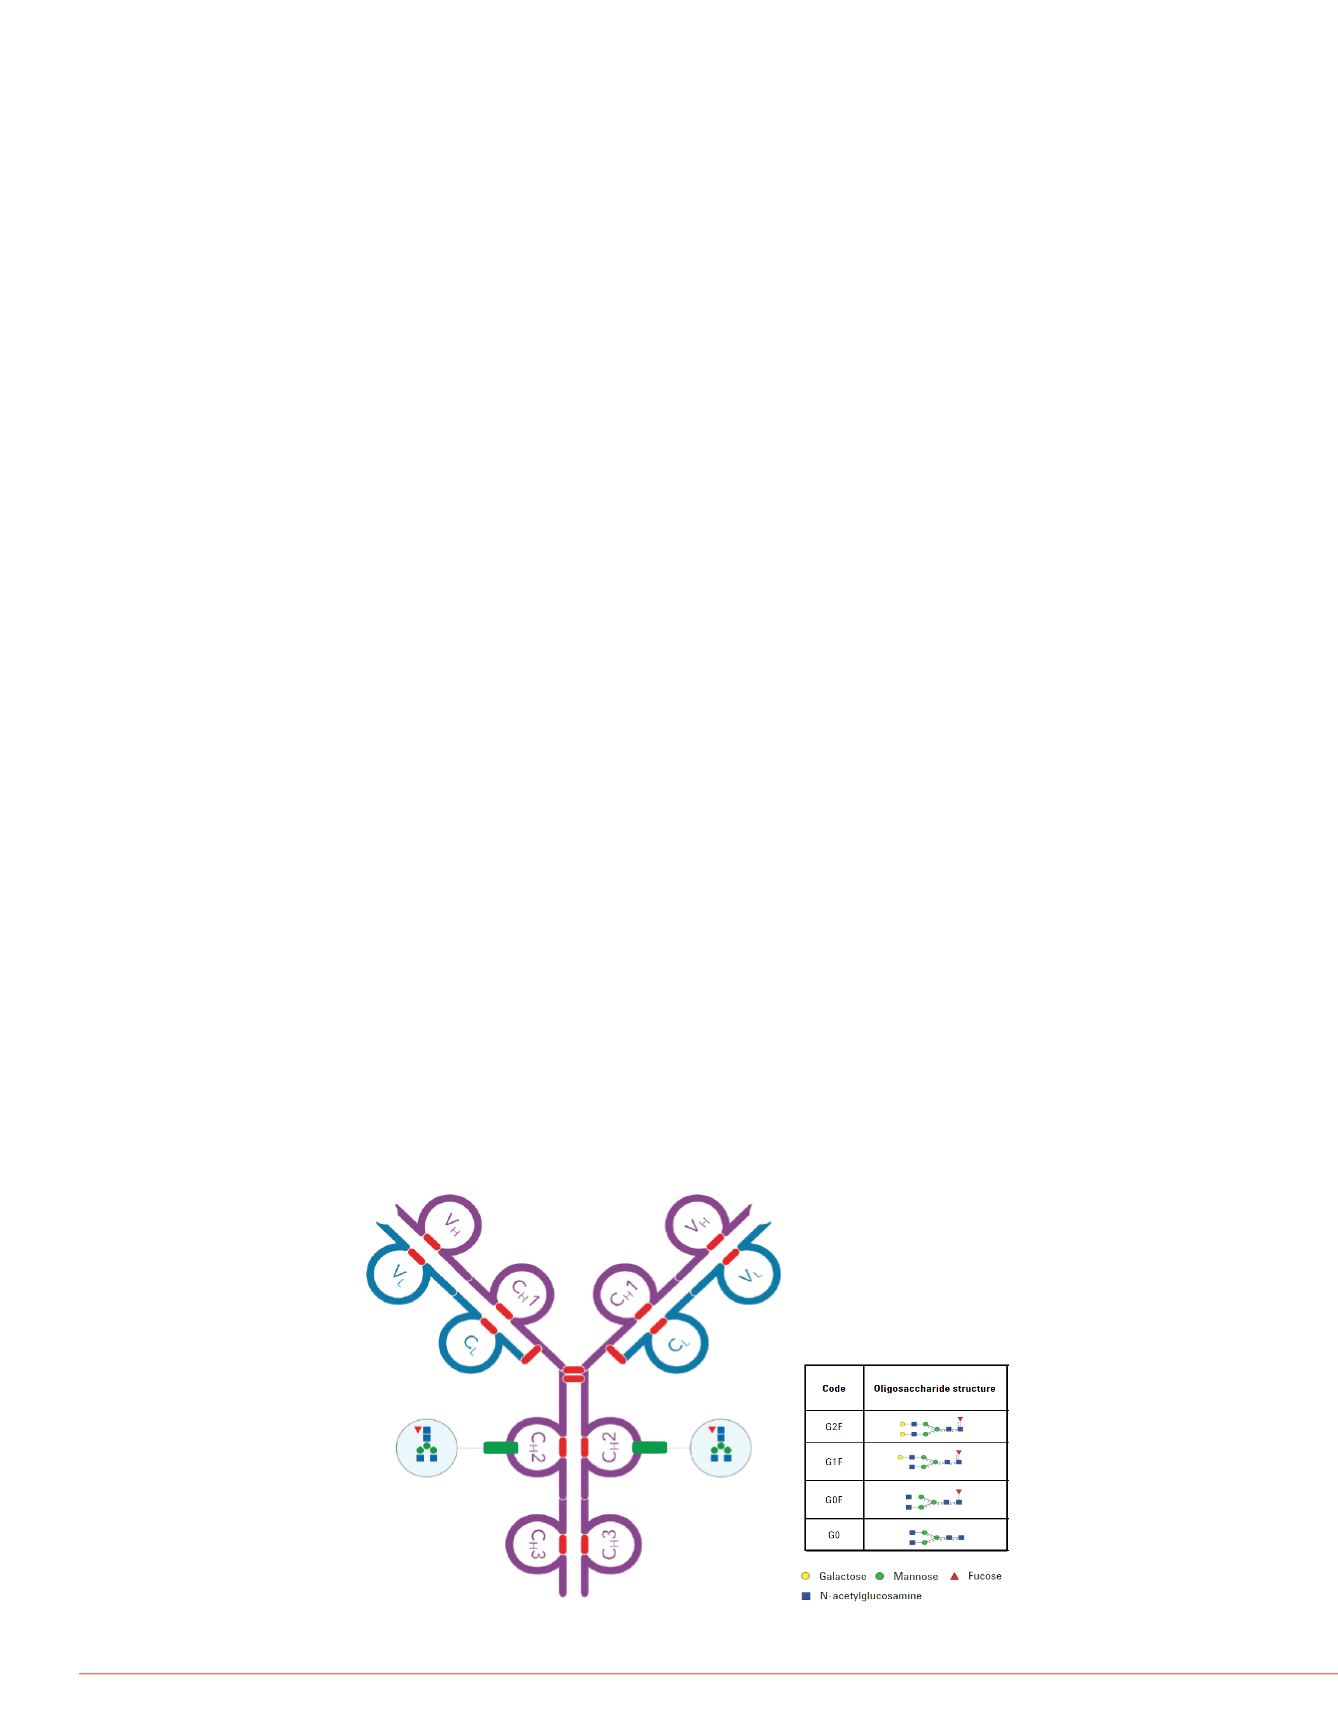
FIGURE 1. Schematic representation of the structure and glycoforms for
Herceptin IgG monoclonal antibody.
FIGURE 3. Deconvolute
antibody. The deconvol
from Protein Deconvol
.
.
G0+G0
Orbitrap technology is ca
when appropriate toleran
transients could be used
separation of its isotopes
out on a modified Orbitra
high-field Orbitrap mass
assemblies Software wa
Asn
300
Asn
300
.
long to be processed usi
were trapped in the HCD
transients were averaged
4.


