3
Thermo Scientific Poster Note
•
PN ASMS13_T219_EDamoc_e 07/13S
Results
Orbitrap MS Analysis of Herceptin Antibody in Denatured and Native Forms
In contrast to electrospray ionization (ESI) MS spectra of denatured antibody where
FIGURE 4. Ultrahigh resolution Orb
resolved [M+51H]
51+
ions of intact
length of three seconds were avera
s in native and denatured
ometry
observed charge states ranged from 34+ to 62+, in native ESI-MS spectra, the signal
is spread over only a few charge-state peaks, primarily 23+ to 28+ (Figure 2). Different
glycoforms of the antibody are clearly baseline-resolved, allowing their accurate
assignment. For example, the peak observed at 148056.95 Da can be attributed to two
G0F oligosaccharidic chains (
Δ
m = 2.4ppm), whereas the remaining six glycoforms
hcD) analysis of intact
tation to perform top-down
s
1/51
can be assigned to G0/G0, G0F/G0, G0F/G1F, G0F/G2F (or G1F/G1F), G1F/G2F and
G2F/G2F glycoforms (Figure 3).
considerable importance over
mmune diseases. Mass
l t l
d f th l i
f
100
2907.27563
R=339004
2910 4321
G0F+
(or 2G
G0F+G0F
G0F+G1F
2907.25
2907
m/z
a oo s use or e ana ys s o
ation on antibody properties
ges, and post-translational
ass spectrometric analysis is
ample preparation steps prior
digestion and release of
FIGURE 2. Orbitrap mass spectra of the Herceptin antibody in denatured and
native forms. Spectra were acquired at a resolution setting of 17,500 using
modified Q Exactive and Exactive Plus instruments.
46+
45+
60
70
80
90
ndance
.
R=337604
G0F+G0
,
top-down approach that uses
nalysis of intact mAbs in
60
70
80
90
100
ndance
3294.767
3369.633
3154.638
3088.943
3447.922
3025.893
2965 343
3294.767
3223.124
3226.666
3219.647
3291.188 3298.404
3301.975
3230 197
3216.437
denatured
ded
20
30
40
50
Relative Abu
29
R
2901.27173
R=351900
2898.44873
R=348704
2894.83960
R=376304
2892.60229
R=377704
G0+G0
Orbitrap MS/MS Analysis of Hercep
ure 1) was buffer exchanged
nium acetate using Micro Bio-
0
10
20
30
40
50
Relative Abu
.
3530.056
2907.266
2851.409
3616.137
2797.570
3706.528
2695.873
3801.425
2601.420
4007.002
3180 3200 3220 3240 3260 3280 3300 3320 3340
m/z
.
3287.947
3280.972
3209.727
3305.632
3233.765
unfol
2890
2895
2900
2905
2910
m/z
0
10
Comparison of HCD data acquired in
high similarity in terms of location of t
b and y (134 vs. 132) fragment ions (
cleavage sites are located in the disul
light chain has been well sequenced
analyzed at a concentration of
n a mixture of
t
difi d Th
2000
2500
3000
3500
4000
4500
m/z
25+
24+
ractions
70
80
90
100
nce
6176.71
5929.60
6176.71
6170.03
6183.46
5929.60
-
,
by the identification of both b- and y-fr
observed for the N-terminal part of th
Glu1 residue was detected. The regio
second and third constant domains a
also well covered. The large portion o
on mo e ermo
ctive™, and Thermo
n electrospray or static
CD) was employed for the
ETD), HCD, and electron
re used on a modified Orbitrap
native
folded,
n-covalent inte
20
30
40
50
60
Relative Abunda
6445.35
5701.38
6738 50
5923.16
5936.03
6190.18
6163.82
5942.41
5917.18
6150.97
5904.81
6201 46
5953 25
sequenced with HCD could be explai
secondary and tertiary structure of th
partially retained in denatured form a
Protein Deconvolution™ 2.0
no
2000 3000 4000 5000 6000 7000 8000 9000 10000
m/z
0
10
.
5490.22
7060.36
5850 5900 5950 6000 6050 6100 6150 6200 6250
m/z
.
.
and glycoforms for
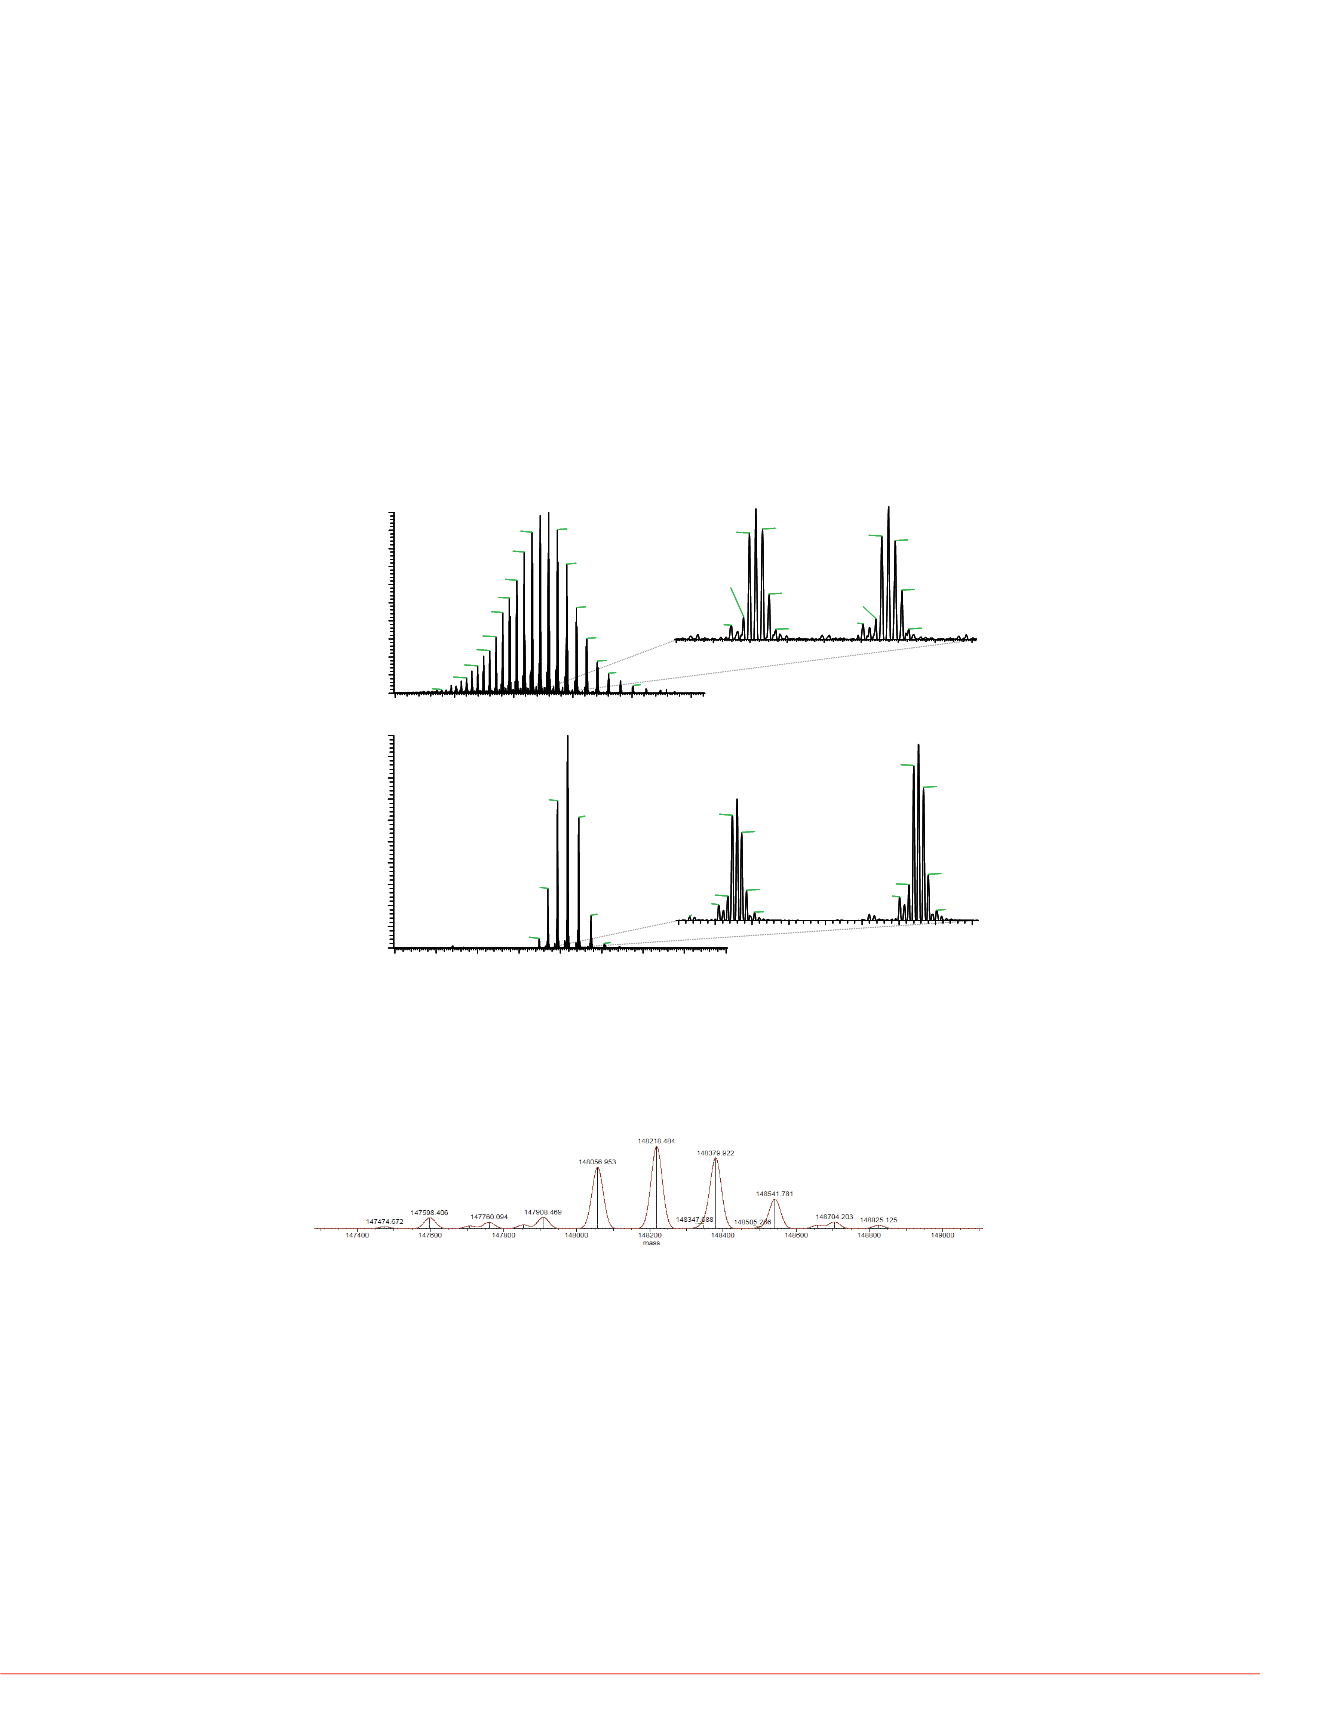
FIGURE 3. Deconvoluted Orbitrap mass spectrum of the intact Herceptin
antibody. The deconvolution was performed using the ReSpect™ algorithm
from Protein Deconvolution 2.0 software.
FIGURE 5. HCD mass spectra of He
forms and ProSightPC software re
Q Exactive and Exactive Plus instr
- 1.1ppm
100
x5
132 fragment ions (96b + 3
G0F+G1F
G0F+G2F (or 2G1F)
G1F+G2F
G2F+G2F
G0F+G0F
+ 2.4ppm
+ 4.1ppm
- 6.6ppm
- 5.3ppm
G0F+G0
G0+G0
Orbitrap technology is capable of ultrahigh resolving power in excess of 1,000,000
when appropriate tolerance and tuning requirements are met [1] Three second long
0
20
40
60
80
Relative Abundance
569.3289
z=1 1838.9216
z=7
2601.6143
z=9
470 2639
denatured
.
-
transients could be used for the analysis of intact Herceptin antibody wherein baseline
separation of its isotopes has been demonstrated (Figure 4). Experiments were carried
out on a modified Orbitrap Elite hybrid mass spectrometer equipped with a compact
high-field Orbitrap mass analyzer specifically selected from a batch of serial
assemblies Software was custom modified to allow transients up to three seconds
20
40
60
80
100
.
z=1
2145.2500
z=6
2574.1018
z=5
804.3600
z=1
5687 7773
3758 8342
native
.
long to be processed using advanced signal processing [2]. Intact Herceptin 51+ ions
were trapped in the HCD cell using He gas as described by Shaw
et al.
[3], and 500
transients were averaged to obtain the ultrahigh resolution spectrum shown in Figure
4.
2000
4000
6000
m/z
0
.
z=?
.
z=1
134 fragment ions (93b + 4


