4
Top-Down Analysis of Intact Antibodies Using Orbitrap Mass Spectrometry
Denatured and Native Forms
ectra of denatured antibody where
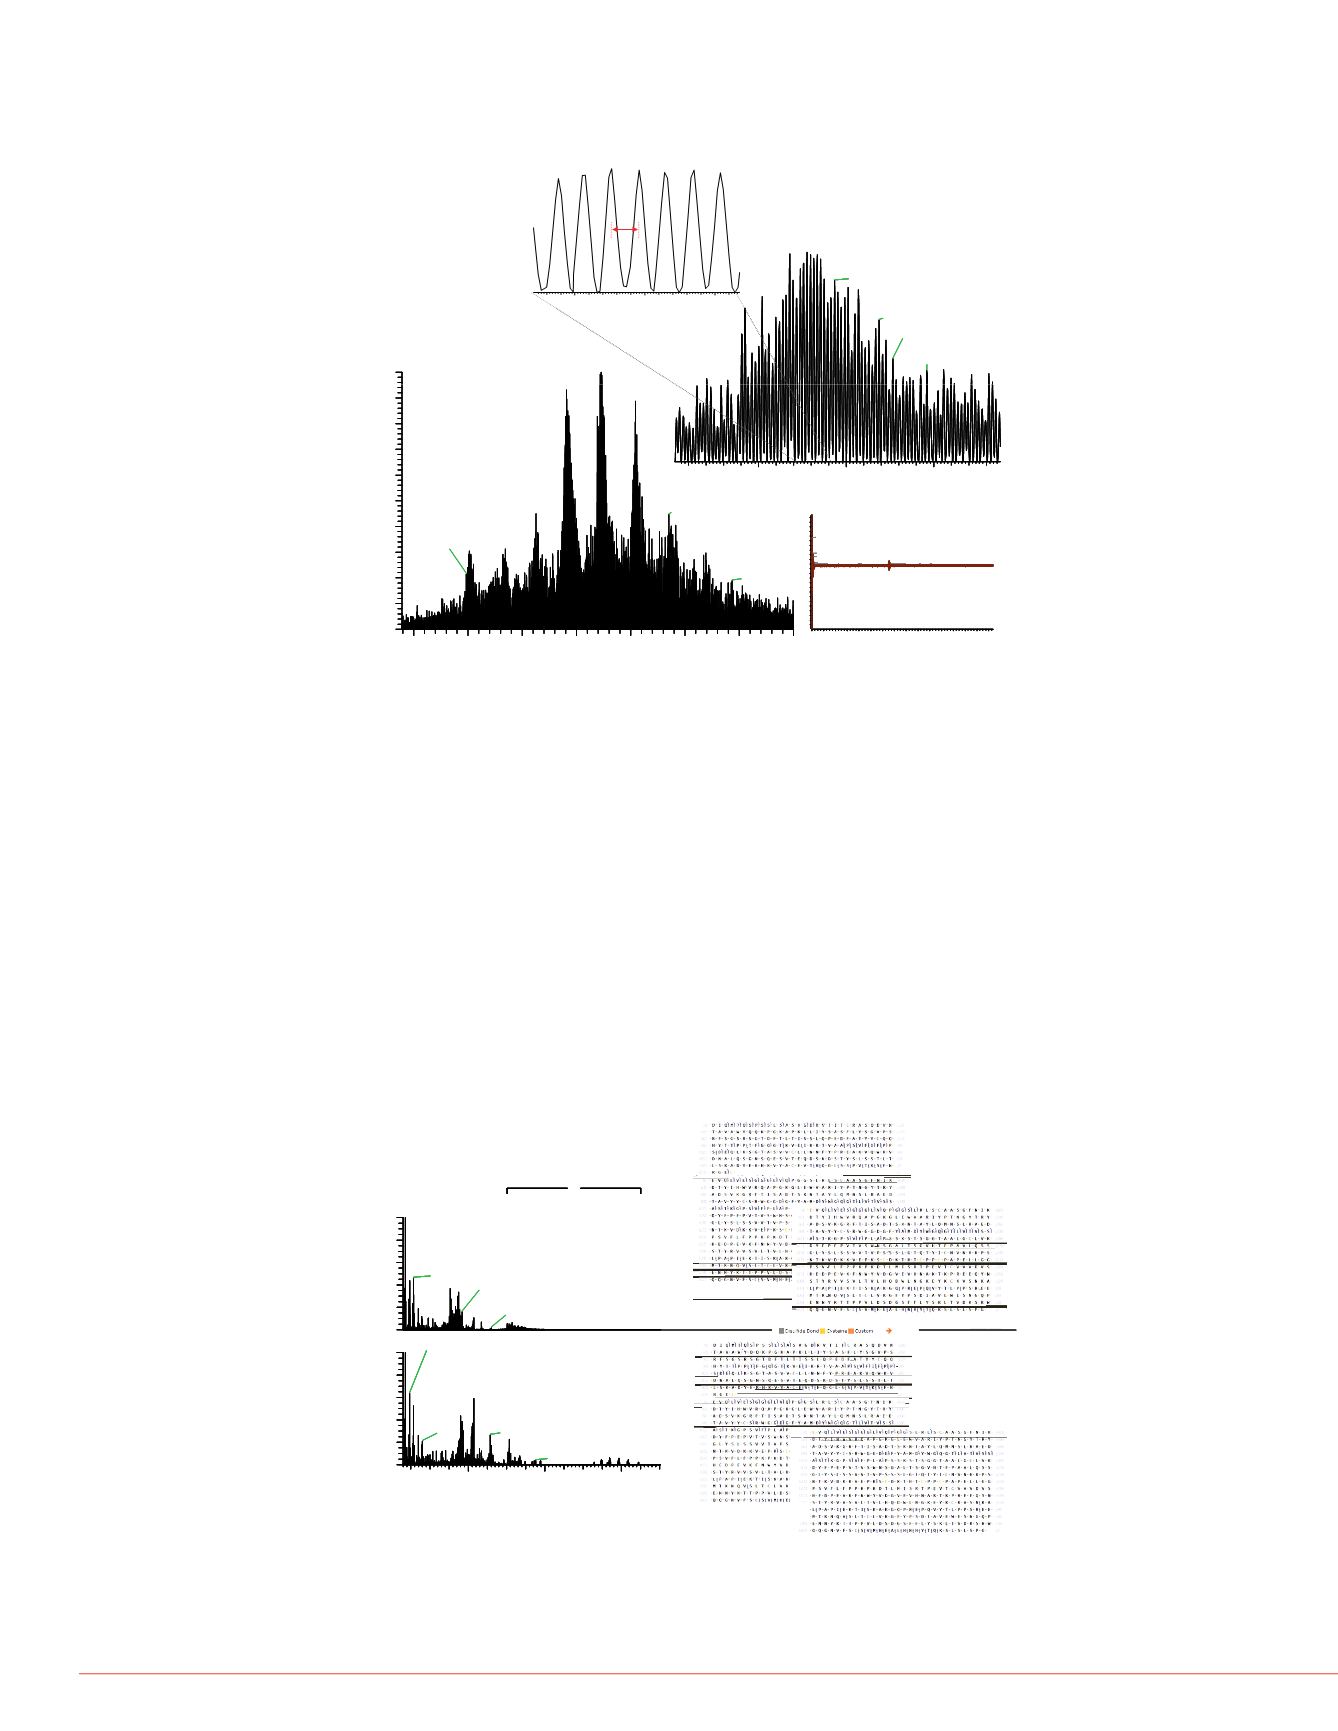
FIGURE 4. Ultrahigh resolution Orbitrap SIM scan showing baseline isotopically
resolved [M+51H]
51+
ions of intact Herceptin antibody. 500 transients with a
length of three seconds were averaged on an Orbitrap Elite instrument.
Based on work done by Horn
e
intact Herceptin mAb on the Or
resolution settings (120,000; 2
resolving power is required to r
example showing the need of
in native ESI-MS spectra, the signal
marily 23+ to 28+ (Figure 2). Different
solved, allowing their accurate
48056.95 Da can be attributed to two
reas the remaining six glycoforms
2907.27563
R=339004
2907.43384
R=348304
G0F+G1F
[M+51H]
51+
1/51
intact antibodies is illustrated i
Herceptin mAb shows baseline
chain) and b
113
(heavy chain) 8
(Developer’s Kit only). At a low
isotopic patterns with a delta of
0F/G2F (or G1F/G1F), G1F/G2F and
100
2907.27563
R=339004
2910 43213
2907.68774
R=374704
2907.76611
R=363604
2907.96045
R=345904 2908.31396
R=322904
2906.70483
R=312904
G0F+G2F
(or 2G1F)
G0F+G0F
G0F+G1F
2907.25
2907.30
2907.35
m/z
unambiguous assignment of b
120,000, it is not possible to re
fragment ions.
FIGURE 6 HCD mass spectr
ptin antibody in denatured and
lution setting of 17,500 using
ents.
46+
45+
60
70
80
90
ndance
.
R=337604
2907.0
2907.5
2908.0
m/z
G1F+G2F
G0F+G0
.
showing baseline resolved o
and b
113
(heavy chain) fragm
8+
3294.767
3223.124
3226.666
3219.647
3291.188 3298.404
3301.975
3230 197
3216.437
red
20
30
40
50
Relative Abu
2913.51001
R=328404
2901.27173
R=351900
2898.44873
R=348704
2916.92334
R=285704
2894.83960
R=376304
2919.33813
R=336404
2892.60229
R=377704
44
45
46
47
48
49
50
51
52
53
54
55
56
57
58
59
60
61
Relative Intensity
8.1702
16.1770
23.8689
1313.4683
40.3564
1329.9382
2814.1560
48.9254450.6222
1026.8643
2384.3368
839.1848
1406.4265
2599.9684
1839.53582008.9512
2947.1843
G2F+G2F
G0+G0
3 sec transient
1555.0
1555.5
1556.0
1556.5
1556.15149
R=193004
1555.77637
R=187004
1556.
R=18
z
z=8
z=8
- NH3
Orbitrap MS/MS Analysis of Herceptin Antibody in Denatured and Native Forms
0 3200 3220 3240 3260 3280 3300 3320 3340
m/z
.
3287.947
3280.972
3209.727
3305.632
3233.765
2890
2895
2900
2905
2910
2915
2920
2925
m/z
0
10
0
200
400
600
800
1000 1200 1400 1600 1800 2000 2200 2400 2600 2800 3000
m/z
38
39
40
41
42
43
Time (msec)
0
50
100
Relative Abundance
1527.
R=1
z
569.32831
R=356501
z=1
1358.21777
R=208000
z=9
785.40265
R=287201
z=1
HCD spectrum
Comparison of HCD data acquired in native vs. denatured conditions showed very
high similarity in terms of location of the assigned cleavage sites and total number of
b and y (134 vs. 132) fragment ions (Figure 5). In both cases most of the assigned
cleavage sites are located in the disulfide-bond free regions. The central portion of the
light chain has been well sequenced with at least six backbone cleavages confirmed
500
25+
24+
6176.71
6170.03
6183.46
5929.60
500
1000
15
40
60
80
100
Abundance
Deconvoluted HCD spectrum
- NH3
-
,
by the identification of both b- and y-fragment ions. Good sequence coverage was also
observed for the N-terminal part of the heavy chain where pyroglutamate formation at
Glu1 residue was detected. The regions between variable and first constant domain,
second and third constant domains and the C-terminal part of the heavy chain were
also well covered. The large portion of light and heavy chains which was not
5923.16
5936.03
6190.18
6163.82
5942.41
5917.18
6150.97
04.81
6201 46
5953 25
12430
12435
0
20
Relative
12433.13041
FIGURE 7 Overlapping isot
sequenced with HCD could be explained by the presence of disulfide-bridges and
secondary and tertiary structure of the antibody in native form which is most probably
partially retained in denatured form as well.
00 10000
0 5900 5950 6000 6050 6100 6150 6200 6250
m/z
.
.
100
.
chain) fragment ions meas
different resolution settings.
rum of the intact Herceptin
sing the ReSpect™ algorithm
FIGURE 5. HCD mass spectra of Herceptin antibody in denatured and native
forms and ProSightPC software results. Spectra were acquired using modified
Q Exactive and Exactive Plus instruments.
100
0
20
40
60
80
1
1557.49780
R=57104
R=120k@400
100
x5
132 fragment ions (96b + 36y)
G0F+G2F (or 2G1F)
G1F+G2F
G2F+G2F
+ 4.1ppm
- 6.6ppm
- 5.3ppm
100
0
20
40
60
80
RelativeAbundance
1557.50610
R=118104
R=240k@400
**
* **
ing power in excess of 1,000,000
nts are met [1] Three second long
0
20
40
60
80
Relative Abundance
569.3289
z=1 1838.9216
z=7
2601.6143
z=9
470 2639
denatured
(Glu
Pyro-Glu)
1557.5
0
20
40
60
80
1
1557.50427
R=184504
R=480k@400
**
**
.
-
Herceptin antibody wherein baseline
(Figure 4). Experiments were carried
trometer equipped with a compact
cted from a batch of serial
ow transients up to three seconds
To further improve the sequen
was performed on the intact H
Figure 9). Averaging 768 msec
20
40
60
80
100
.
z=1
2145.2500
z=6
2574.1018
z=5
804.3600
z=1
5687 7773
3758 8342
native
essing [2]. Intact Herceptin 51+ ions
scribed by Shaw
et al.
[3], and 500
esolution spectrum shown in Figure
experiment resulted in identific
the light chain and 138 fragme
This corresponds to a sequenc
heavy chain. The total sequen
2000
4000
6000
m/z
0
.
z=?
.
z=1
134 fragment ions (93b + 41y)


