3
Thermo Scientific Poster Note
•
BioPharma_PN63944
_E 11/13S
B; 3.0 min, 55% B; 4.0 min, 98% B; 7.0 min, 98% B; 7.1 min, 20% B; 15.0 min, 20% B).
Mass Spectrometry:
Q Exactive instruments were used for this study. Intact and reduced
mAbs were analyzed by ESI-MS for intact molecular mass. Top-down MS/MS was
performed using high energy collision dissociation with a unique spectrum multiplexing
feature (msx HCD). In this data acquisition mode, fragment ions produced from several
individual HCD events, each on a precursor of a different charge state of the reduced mAb,
were detected together in the Thermo
Scientific™
Orbitrap™
mass analyzer. The spray
voltage was 4 kV. Sheath gas flow rate was set at 10. Auxiliary gas flow rate was set at 5.
Capillary temperature was 275 °C. S-lens level was set at 55. In-source CID was set at 45
eV. For full MS, resolution was 17,500 for intact mAb and intact Fab average mass
measurement, or 140,000 for light chain and Fab heavy chain monoisotopic mass
measurement. Resolution was set at 140,000 for top-down MS/MS. The AGC target was
set at 3E6 for full scan and 2E5 for MS/MS. Maximum IT was set at 250 ms.
Data Processing:
Full MS spectra were analyzed using Protein Deconvolution software
that utilizes the ReSpect algorithm for molecular mass determination. Mass spectra for
deconvolution were produced by averaging spectra across the most abundant portion of
the elution profile for the mAb. A minimum of at least 8 consecutive charge states from the
Figure 2: Deconvoluted
errors of average molec
tion Bench-Top Orbitrap LC-MS Workflow So
nal Antibody Characterization
rn
1
, Shiaw-Lin Wu
2
, Xiaoyue Jiang
1
, Andreas FR Huhmer
1
and P
ntific, San Jose, CA, USA;
2
Barnett Institute, Northeastern Unive
ed workflow solution for robust,
(mAb) characterization.
brid quadrupole-Orbitrap mass
nt and top-down sequencing. Full
using Thermo
Scientific™
Protein
ReSpect
TM
algorithm for molecular
ra were analyzed using Thermo
ely achieved for intact mAb mass
on, can be confidently identified on
sing an on-line high resolution top-
n site was covered for intact light
age from top-down approach also
.
ing developed and utilized for
including cancer. Due to the
erization is necessary for their
cal tools used for the analysis of
re and more important in providing
h information includes intact mass,
ns including glycosylation form
ng and handling, and high order
sually the first step. In this study, a
eveloped for robust, accurate and
in level.
The fast chromatography,
e Q Exactive LC/MS system, and
high-confident screening tool to
reduce intact mAb, the sample was
dine-HCl containing 5 mM DTT for
erated using papain in 1mM EDTA,
.0. Before digestion, the enzyme
in the same buffer at an enzyme:
7 °C overnight using an enzyme:
lithic column (1 x 50mm) was used
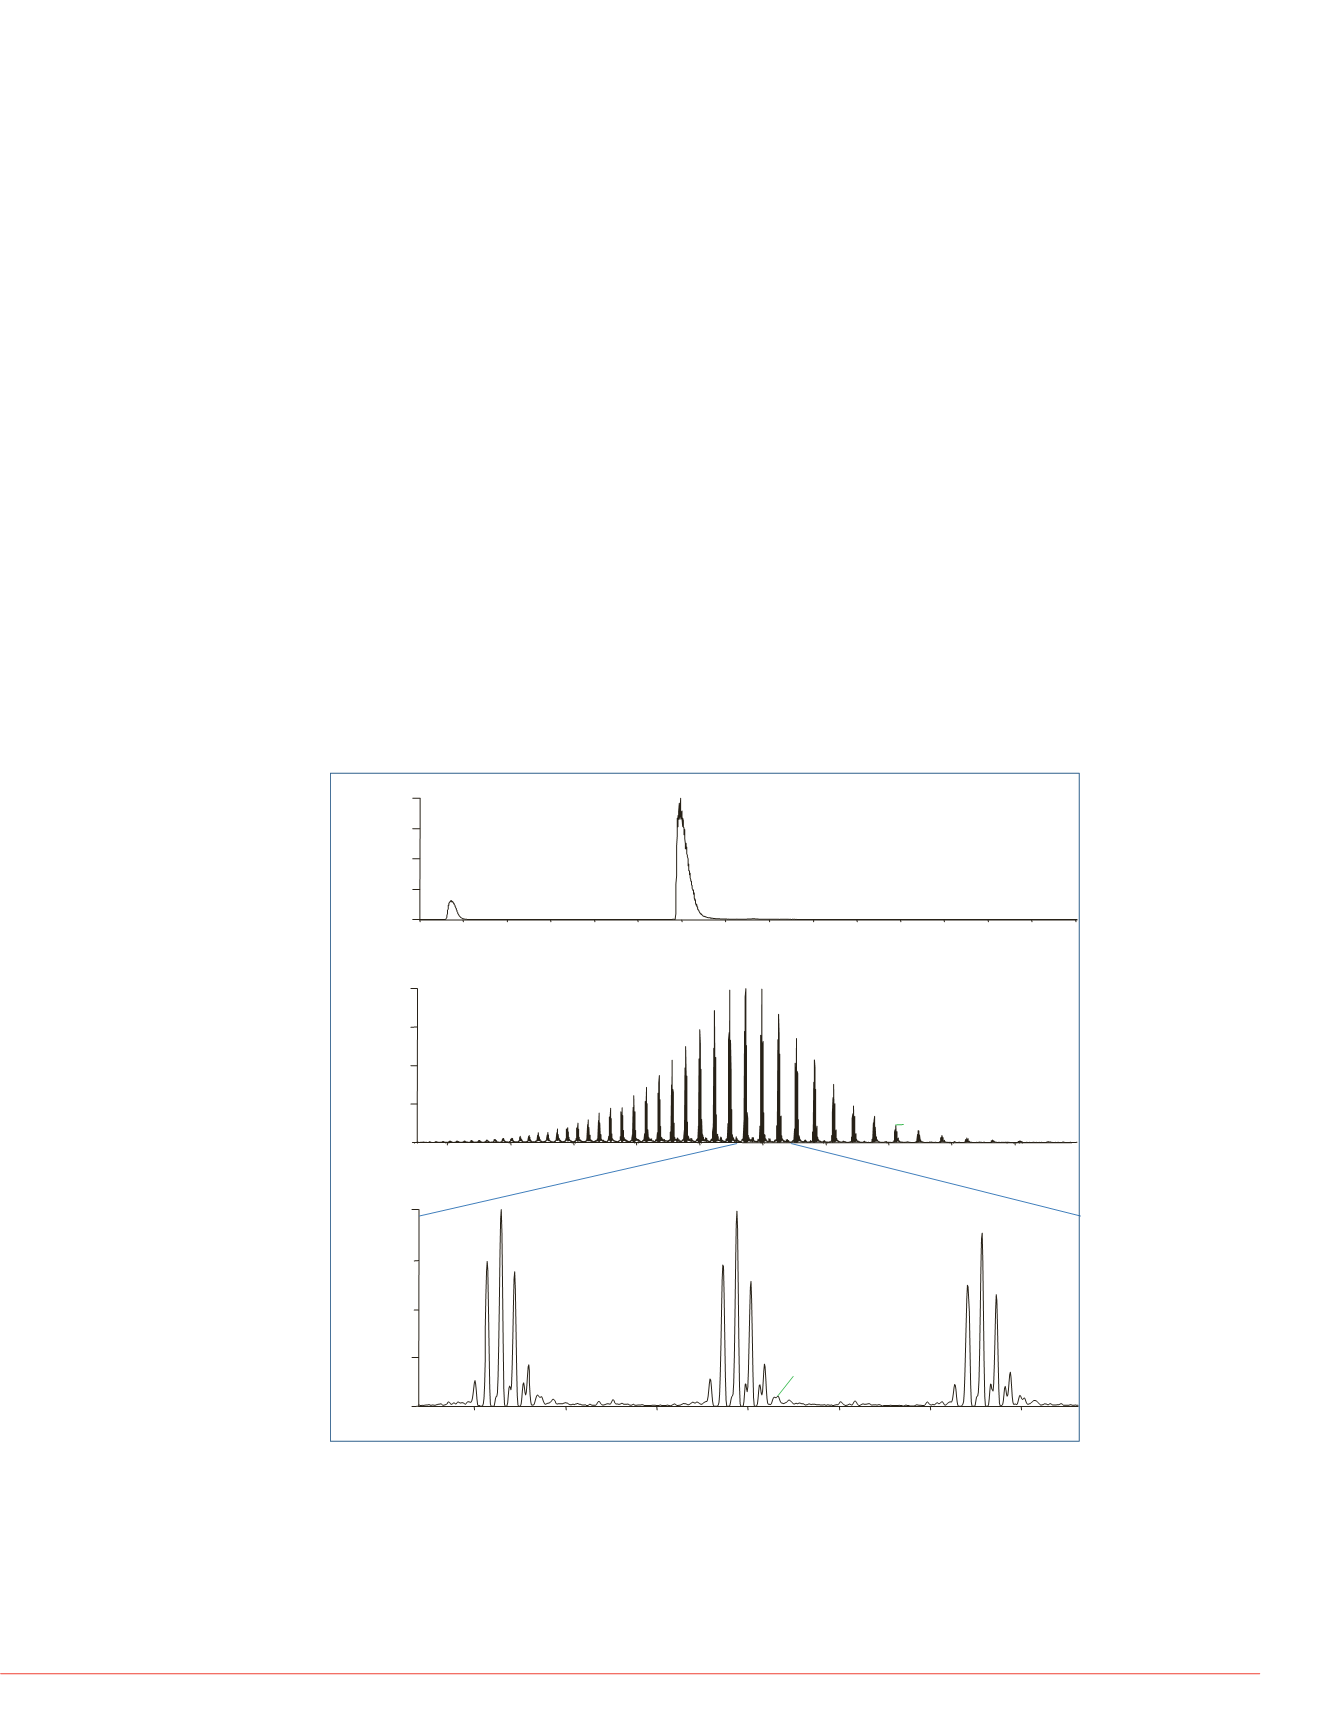
Figure 1: Intact mAb analysis using LC MS
One microgram of mAb was desalted and eluted from a ProSwift RP-10R monolithic
column using a 15 min gradient and analyzed using ESI-MS on the Q Exactive MS. As
shown in Figure 1, the mAb was eluted over one minute as shown in (A). The average
spectrum over the elution time shows a nicely distributed complete charge envelope of
the mAb (B). A zoom-in view of each charge state reveals five major glycosylation forms
that are baseline separated (C).
After each of the mAb datasets were analyzed using the Protein Deconvolution software,
Results
To measure the mass acc
MS in conjunction with Pro
several times using two dif
ppm mass accuracy are s
various glycoforms are sh
Table 1: ppm mass devia
abundant glycoforms
The average ppm error for
instruments was
6.9 ppm
shown here). This indicate
confirmation of protein pri
Table 2. Relative abunda
For the top 5 glycoforms, t
RAW file Q Exacti
1
1
2
1
3
1
4
2
5
2
6
2
RAW file Q Exactive
1
1
2
1
3
1
4
2
5
2
6
2
CV
Figure 3: Identification of
input m/z spectrum were used to produce a deconvoluted peak. To identify glycoforms,
the masses were compared to the expected masses with the various combinations of
commonly found glycoforms. The top-down msx HCD spectra were analyzed using
ProSightPC software in the single protein mode with a fragment ion tolerance of 5 ppm.
0
1
2
3
4
5
6
7
8
9
10
11
12
13
14
Time(min)
0
25
50
75
100
5.96
0.72
RelativeAbundance
1800
2000
2200
2400
2600
2800
3000
3200
3400
3600
m/z
0
25
50
75
100
2745.7679
2647.7513 2851.3306
2601.3078
2907.2147
2556.4895
2965.3315
2513.1806
3025.8504
2430.8234
3088.8689
2353.6702
2281.3101
3154.5911
2213.1896
3223.1069
2740
2760
2780
2800
2820
2840
2860
m/z
0
25
50
75
100
2745.7679
2797.5560
2851.3306
2742.8007
2794.5360
2748.7715
2800.6205
2848.2716
2854.4543
2751.7736
2857.5893
2806.5649
2754.6350
Total Ion Chromatogram
Average Spectrum of
Intact mAb Charge Envelope
G0F+G1F
G0F+G2F
G1F+G2F
G0F+G0F
G0F+G0F
A
B
C
Intact Fab
Resolution =17.
75
100
e
1430.63
1475.31
1388.57
1522.87
1348.92
1573.


