5
Thermo Scientific Poster Note
•
PN3078-1_e 05/12S
Conclusion
§
Using Protein-A Affinity, MAbPac
characterized by affinity purificati
less than one hour.
§
The separation of the lysine varia
is an effective approach, orthogo
§
The combination of off-line IEC s
efficient way to obtain structural i
References
1.Decrop, W.; Swart, R. Developm
and Analysis.
J. Biomol. Tech
.
20
2.Rea, J., Moreno, T., Lou, Y., and
Ion-exchange Chromatography
Charge Variant Separations.
J. P
Acknowledgemen
We would like to thank Terry Zhang
the MS data.
Poros is a registered trademark of Applied Bios
Scientific and its subsidiaries. This information i
might infringe the intellectual property rights of
LPN 3078-1
jected onto the
f IgG material for the
ollected into a
ction time was
00 µL. Chromeleon
eak triggers, or both
here, there was a
the flow path to each
3) or IEC (Figure 4).
ithout further
a linear salt gradient
carboxypeptidase
ced others,
SCX-10 3 µm column
time for all three
ion programs
therefore multiple
-gradient-based IEC
this study, we applied
column. As shown in
jor peaks 1, 2, and 3
-3000 allowed real-
ll the analyses. The
.6, and 8.7,
ss spectrometer
column was carried
showed that the major
148155.503 and
additional hexoses.
lta mass between
milarly, the delta
28 amu. These data
variants of Peak 3.
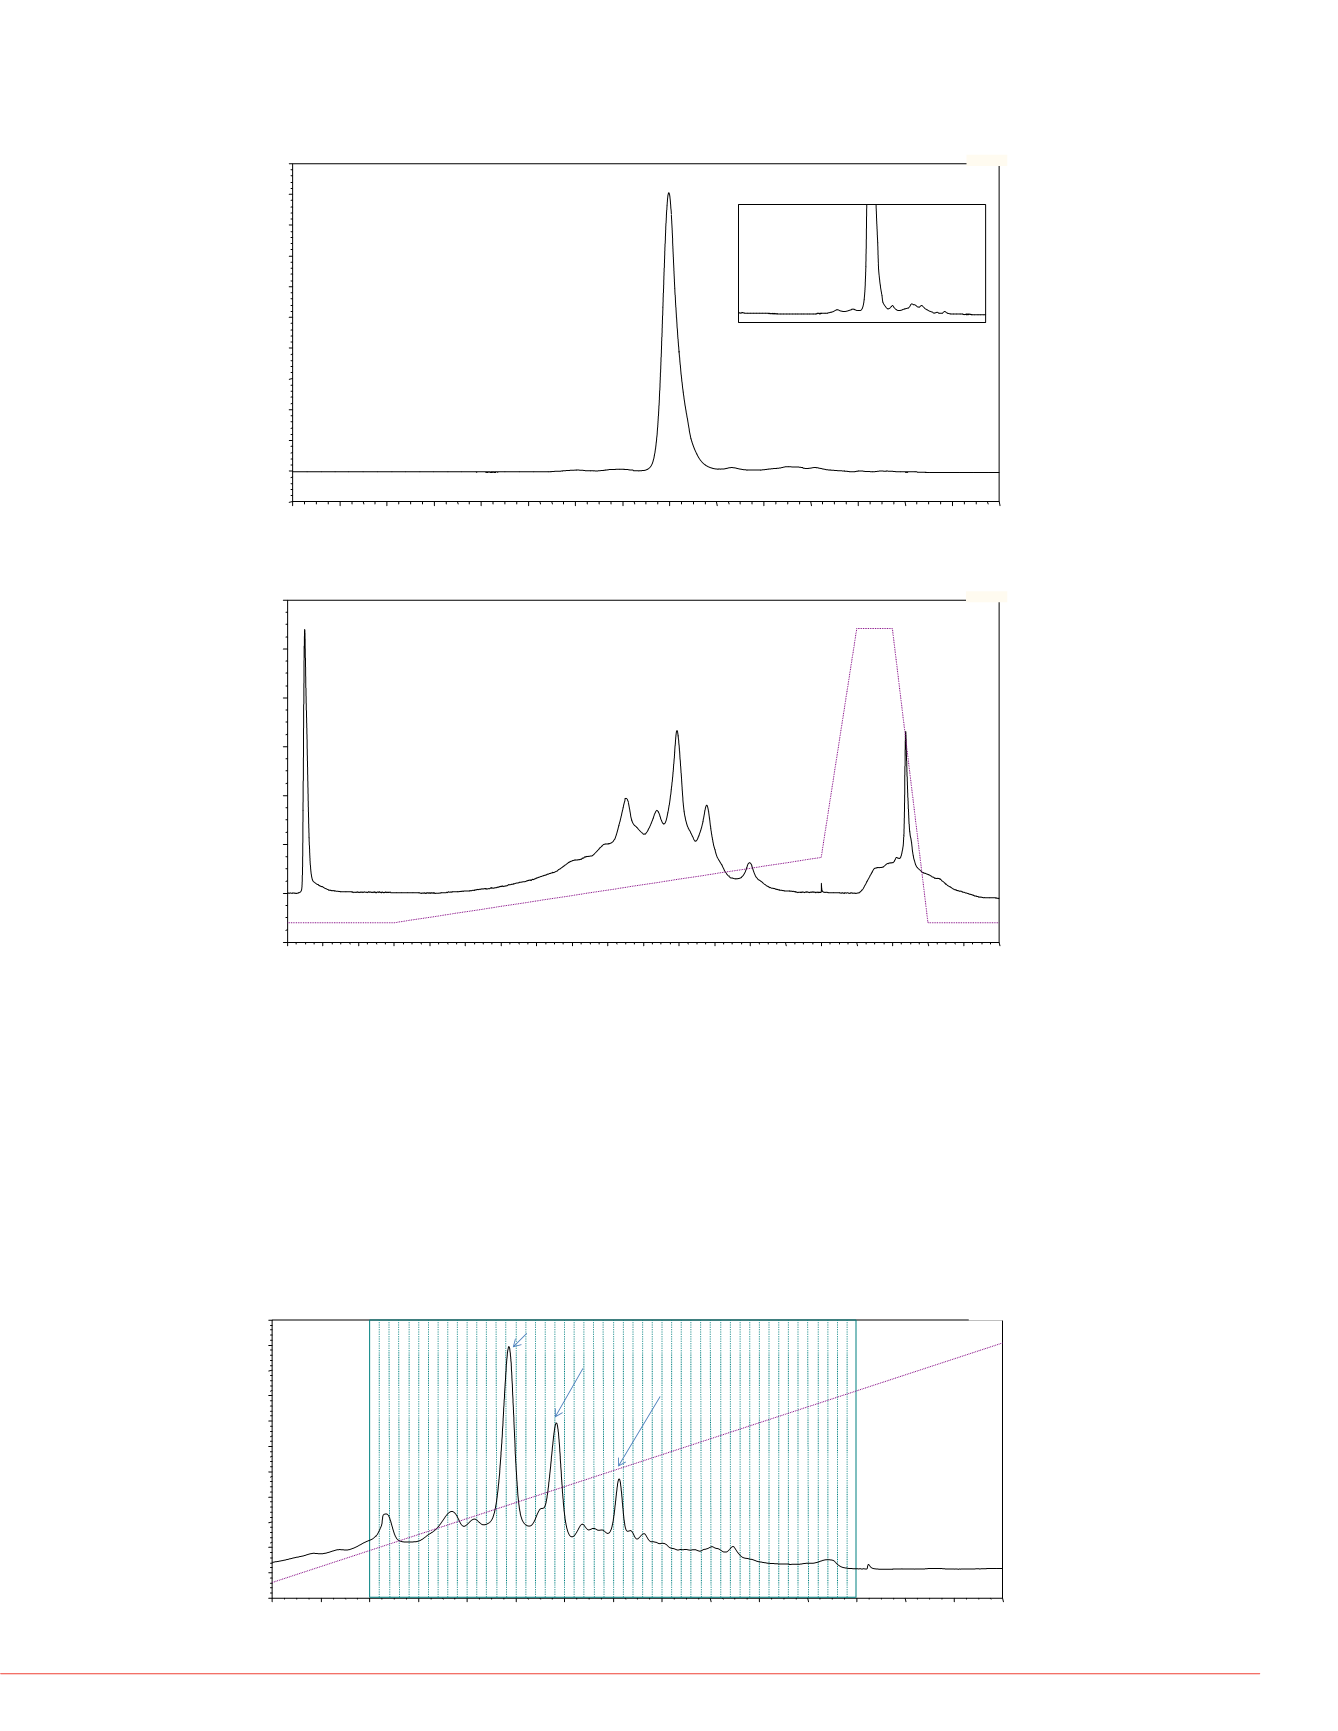
FIGURE 4. Example of a
2
D SCX separation of a purified IgG fraction collected
from the MAbPac SCX-10, 3 µm, 4 × 50 mm column
FIGURE 3. Example of an isocratic
2
D SEC separation of a purified IgG fraction
collected from the MAbPac SEC-1, 4 × 300 mm column
CC: the vertical
2.20
2.40
2.60
2.80
3.00
UV_VIS_1
min
WVL:280 nm
0.0
0.0
0.0
1.0
2.0
3.0
4.0
5.0
6.0
7.0
8.0
9.0
10.0
11.0
12.0
13.0
14.0
15.0
-5.0
0.0
5.0
10.0
15.0
20.0
25.0
30.0
35.0
40.0
45.0
50.0
UV_VIS_1
mAU
min
WVL:280 nm
SEC Conditions:
Column: MAbPac SEC-1, 4 × 300 mm
Mobile Phase:50 mM NaH
2
PO
4
, 300 mM NaCl,pH 6.8
Flow Rate: 0.3 mL/min
Temperature: 30
°
C
0.0
1.0
2.0
3.0
4.0
5.0
6.0
7.0
8.0
9.0
10.0
11.0
12.0
13.0
14.0
15.0
16.0
17.0
18.0
19.0
20.0
-1.00
0.00
1.00
2.00
3.00
4.00
5.00
6.00
UV_VIS_1
mAU
min
WVL:280 nm
Flow:0.600 ml/min
%B IEC high salt:10.0 %
30.0
100.0
10.0
%C:0.0%
SCX Conditions:
Column: MAbPac SCX-10, 3 µm, 4 × 50 mm
Mobile PhaseA: 20 mM MES, 60 mM NaCl, pH 5.6
Mobile Phase B: 20 mM MES, 300 mM NaCl, pH 5.6
Gradient:
linear increase from10 % B to 30% B in 12 min
1 min high salt wash at 100% B
3 min re-equilibration step at 10% B
Flow Rate: 0.6 mL/min
Temperature: 30
°
C
pH-GradientSeparation Conditions:
Column: MAbPac SCX-10, 10 µm, 4 × 250 mm
Mobile PhaseA: 9.6 mM Tris, 11 mM imidazole, and 6 mM piperazine, pH value 6.8
Mobile Phase B: 9.6 mM Tris, 11 mM imidazole, and 6 mM piperazine, pH value 10.8
Gradient:
3 min pre-equilibration at 40% B
followed by linear increase from40 % B to 100% B in 30 min
followed by 7 min high pH wash at 100% B
followed by 15 min re-equilibration step at 40% B
Flow Rate: 1.0 mL/min
Temperature: 30
°
C
Fraction Collection Rate: 0.2 min/well
15.0
16.0
17.0
18.0
19.0
20.0
21.0
22.0
23.0
24.0
25.0
26.0
27.0
28.0
29.0
30.0
-5.0
0.0
5.0
10.0
15.0
20.0
25.0
30.0
35.0
40.0
45.0
50.0
UV_VIS_1
mAU
min
WVL:280 nm
64%B
94%B
1
2
3
FIGURE 5. pH gradient separation of purifed IgG on a MAbPac SCX-10 column
FIGURE 6. Full scan MS spectra
FIGURE 7. Deconvoluted MS spectra
Peak 1
Peak 2
Peak 3
2700
2750
2800
2850
0
20
40
60
80
100
0
20
40
60
80
100
RelativeAbundance
0
20
40
60
80
100
2847.02
2793.33
2741.63
2798.52
28
2747.74
2807.80
2733.32
2838.32
2784.74
2849.48
2795.74
2744.00
2749.89
2801.07
28
2704.71
2756.43
2813.00
2787.13
2735.47
2798.14
2851.90
2746.40
28
2804.18
2752.32
2710.89
2763.17
2817.44
2738.07
-Lys
Peak 1
Peak 2
Peak 3


