5
Thermo Scientific Poster Note
•
PN ASMS13_W442_SLin_e 06/13S
Conclusions
• A linear pH gradient from pH 5.6 to pH 10.2 w
zwitterionic buffer system on a cation-exchan
• A linear pH gradient separation platform ena
charge variant analysis and automation of me
• The combination of off-line IEC separation a
detection provides an efficient way to obtain s
References
1. Farnan, D and Moreno, T. Multiproduct high-r
variant separations by pH gradient ion-excha
81, 8846–57.
rated on a 30-min linear pH
mm column.
Protein name,
beled for each protein peak.
FIGURE 6. Deconvoluted MS Spectra.
alues for six protein component
lue.
The measured pH values of all
eriment shown in Figure 1.
40
Measured pH
Linear(Measured pH)
Intact Mass of MAb variants
An IgG sample was purified from harvest cell c
sample was analyzed via linear pH gradient an
based method (Figure 5). Major fractions collec
a Q Exactive mass spectrometer. On-line desalt
column was carried out prior to MS detection. F
spectra of peak 1, 2, 3, 4, and 5. The deconvolu
component in Peak 1 has a
m/z
at 147993. Adj
correspond to different glycoforms with 1 and 2
component in peak 2 has a
m/z
at 148121. The
is 128 amu, corresponding to one lysine. The d
4 have the same MS profile as Peak 1 and Pea
isomers. The major component in Peak5 has a
Peak 4 and Peak 5 is 129 amu. These data sug
to lysine truncation variants of Peak 5.
es as a function of time.
The
experiment shown in Figure 1.
iamond shape.
e A
Cytochrome C
10.5
Measured pH value
Linear (Measured pH
value)
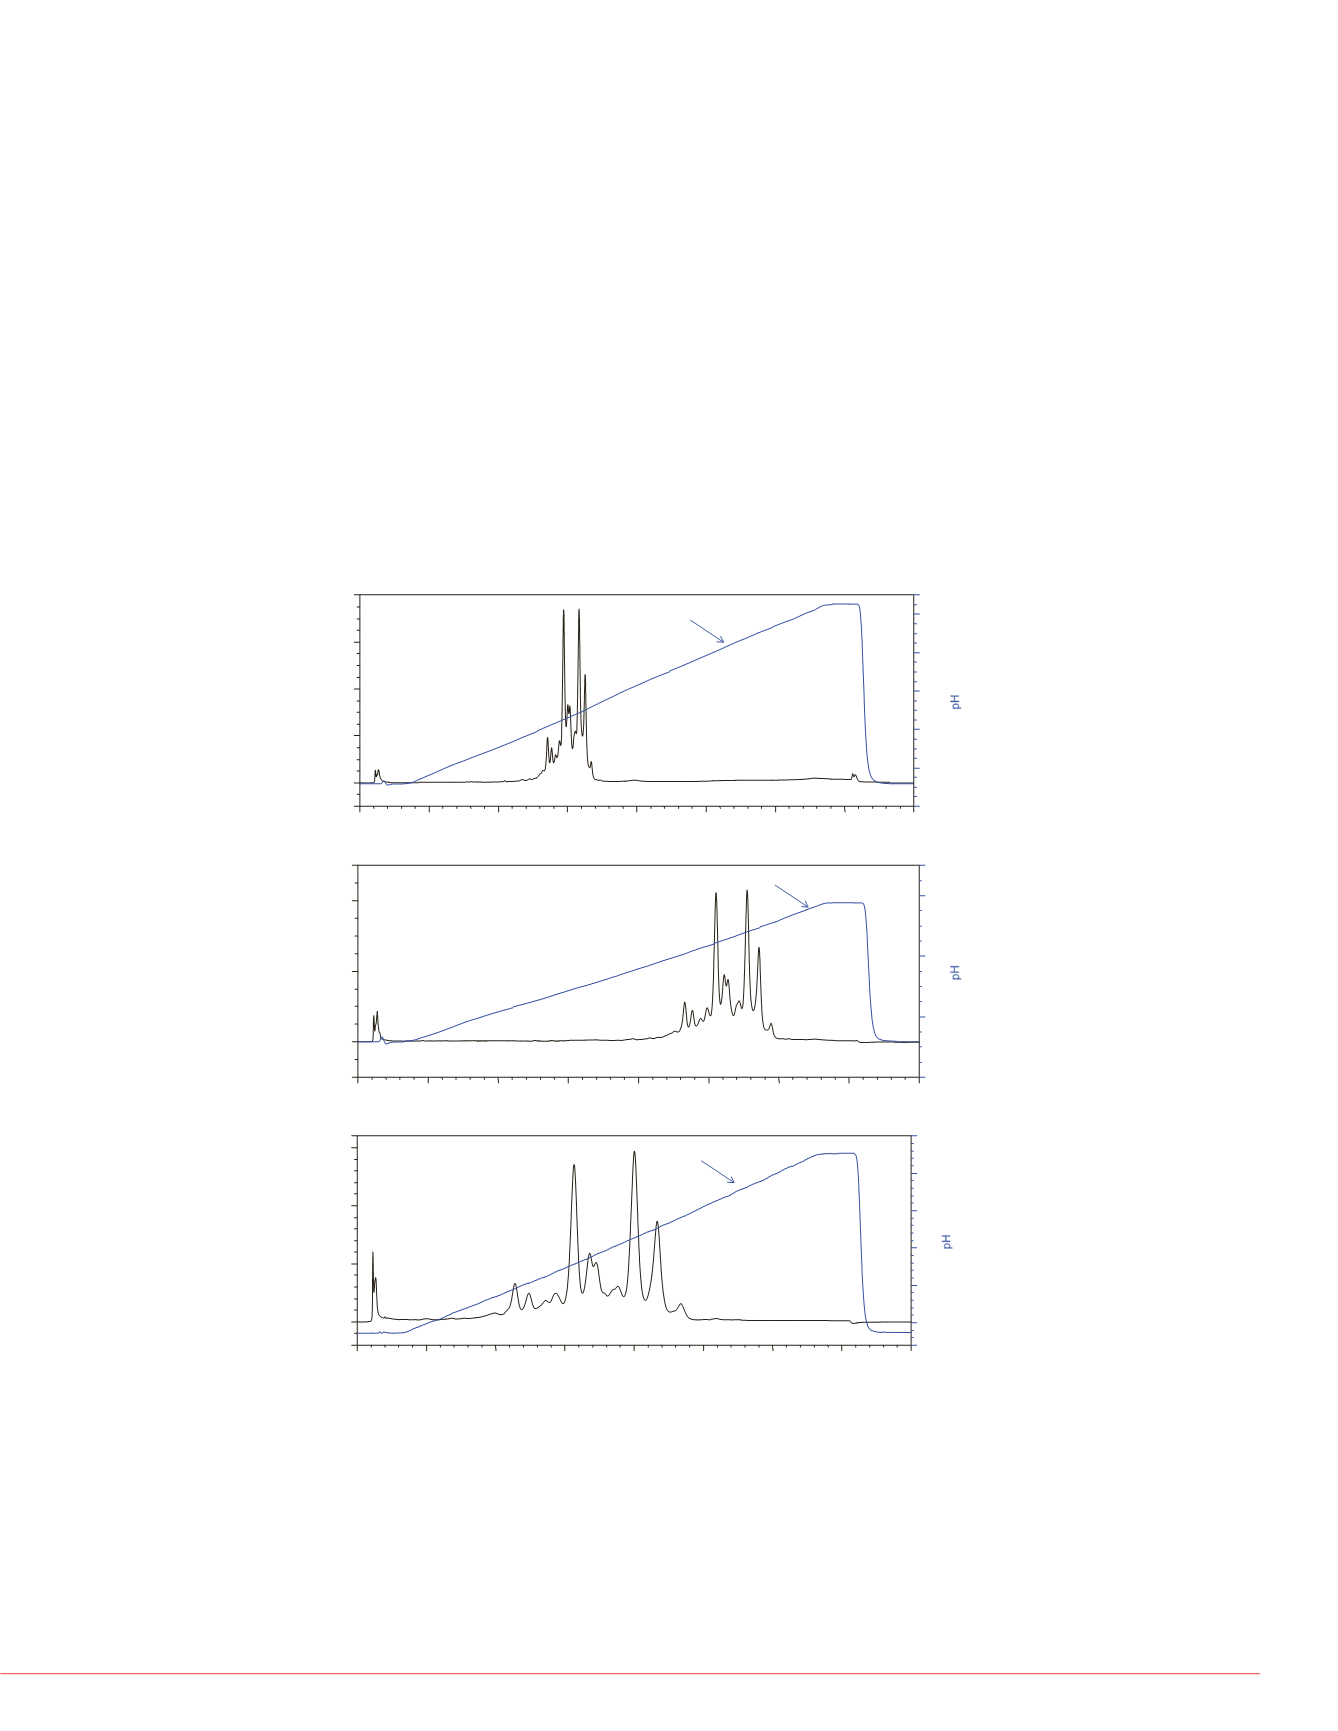
FIGURE 4. An example of MAb charge variant separation by linear pH gradient.
The separation was carried out on a MAbPac SCX-10, 10 µm, 4
×
250 mm column.
(a) Separation by pH gradient, 0% B (pH 5.6) to 100% B (pH 10.2), gradient method
was shown in Table 1; (b) Separation by pH gradient, 0% B (pH 5.6) to 50% B (pH 7.9);
(c) Separation by pH gradient, 25% B (pH 6.75) to 50% B (pH 7.9).
All trademarks are the property of Thermo Fisher Scientific an
encourage use of these products in any manners that might inf
25
30
35
40
ime [min]
RibonucleaseA- 22.00 - 8.53
Cytochrome C - 31.55 - 9.93
0
5
10
15
20
25
30
35
40
-5.0
10.0
20.0
30.0
40.0
5.00
6.00
7.00
8.00
9.00
10.50
Absorbance [mAU]
Retention Time [min]
pH trace
(a)
0
5
10
15
20
25
30
35
40
-5.0
0.0
10.0
20.0
25.0
5.00
6.00
7.00
8.50
Absorbance [mAU]
Retention Time [min]
pH trace
(b)
0
5
10
15
20
25
30
35
40
-2.0
5.0
10.0
16.0
6.60
7.00
7.25
7.50
7.75
8.00
Absorbance [mAU]
Retention Time [min]
pH trace
(c)
pH Gradient Separation Platform for MAb Variants
Most MAbs have pI values in the range of 6 to 10. Our pH gradient separation method
can serve as a platform for charge variant separation. Using a full range of pH gradient
from pH 5.6 to pH 10.2, we established the pH elution range in the initial run (Figure 4a)
with a pH gradient slope of 0.153 pH unit/min. Further optimization of separation can
simply be achieved by running a shallower pH gradient in a narrower pH range. Figure
4b showed the separation profile from pH 5.6 to pH 7.9 with pH gradient slope at 0.076
pH unit/min. Figure 4c showed the separation profile from pH 6.75 to pH 7.9 with pH
gradient slope at 0.038 pH unit/min. The pH traces in Figure 4a, 4b, and 4c
demonstrated that the pH gradient maintain linear when the slope was reduced to ½ or
¼ of the initial run.
Because the chromatographic profile of the variants were predictable when running a
shallower pH gradient. Pump methods for chromatogram shown in Figure 4b and 4c can
be automatically generated by writing a post-acquisition script using the MAb variant pH
elution range information collected in the initial run (Figure 4a). This example illustrates
the advantages of using pH gradient separation platform, which is to simplify and
automate the method development for MAb charge variant separation.
FIGURE 5. pH gradient separation of purifie
separation was carried out on a MAbPac SCX-
30 min linear pH gradient from 40% B (pH 6.52
Peak 1
Peak 2
Peak 3
Peak 5
Peak 4
-Ly
-L
8.0
10.0 12.0 14.0 16.0 1
-5.0
10.0
20.0
35.0
Re


