5
Thermo Scienti c Poster Note
•
PN HUPO13_POS-02-200_MBromirski
_E 09/13S
Conclusion
With a Thermo Scientific Ex
spectrometer proteins easil
state, revealing the accurat
complex as well as clear se
conjugates. Large protein a
down to significant sub-ass
detail evaluation of quarter
For small proteins up to 35
achieved for determination
Larger proteins show clear
and conjugates. Acquisition
rang of seconds.
Sample introduction with th
proved to be easy to handl
stable spray conditions for
with minimum time consum
data acquisition for maximu
Acknowledgeme
We would like to thank Prof
from the University of Uthre
supplying samples of E. col
yruvate Kinase are
hased from Sigma-
re provides by the
echt, The
d prior
BioSpin™ columns,
in column manual.
system to 5 µM
2.
vion TriVersa
ionization in
chip with an
. According to the
uld result in a
rmo Scientific
r. Detection
type of analyte
r determination of
e carried out using
re.
Herceptin
Herceptin is a therapeutic antibody in cancer treatment.
The determination of the glycolysation status is important
for characterization and quality control. For Herceptin, we
could achieve a clear baseline separation and assignment
of the major glycoforms known (see fig. 3). In addition,
present interfering adducts could be resolved clearly
enough to separate them from the antibody signal, so a
correct mass assignment could be achieved.
ass
Applying
in-source
dissociation
energy
e Exactive Plus EMR
Pyruvate Kinase
In native state Pyruvate kinase is a tetrameric protein
assembly of intermediate size. The full protein assembly
appeared as a strong signal in the spectrum and due to full
desolvation of the molecules in the mass spectrometer the
full pattern of isoform combinations is visible (see fig. 4).
Upon slight application for fragmentation energy the
monomeric subunits with their isoform pattern are visible
together with the full assembly. The mass difference of 324
amu is clearly visible in the deconvoluted spectra of the
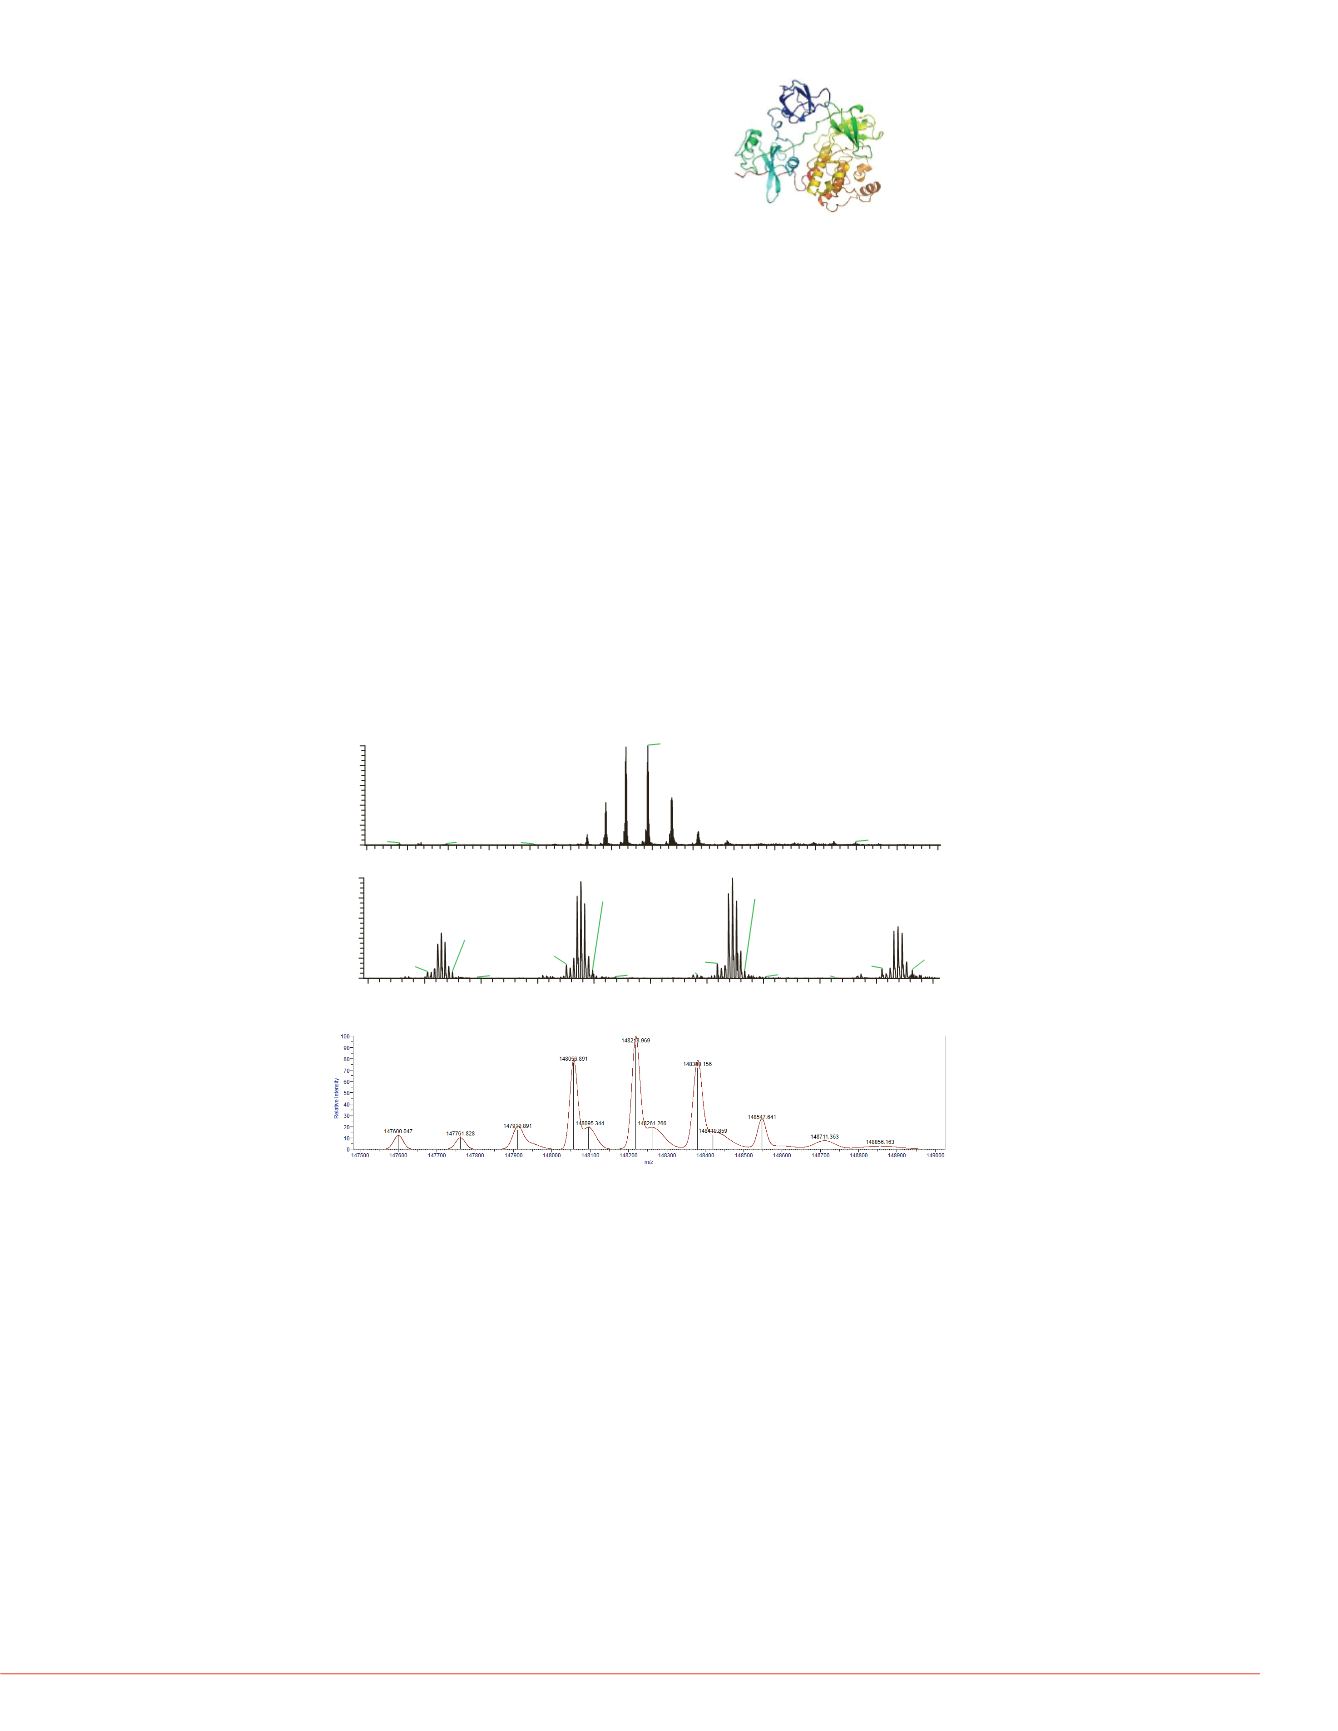
FIGURE 3. Experimental and deconvoluted spectrum
of Herceptin, showing clear resolution of glycoforms
and even resolving smaller adducts which would affect
mass accuracy if not resolved
Herceptin_002
#
164
RT:
6.53
AV:
1
NL:
7.06E4
T:
FTMS+ pNSI sid=200.00 Fullms21000.00@hcd100.00 [500.00-15000.00]
5800
5900
6000
6100
6200
6300
6400
6500
6600
6700
6800
m/z
0
20
40
60
80
100
RelativeAbundance
6445.1807
6176.6475
6738.1323
5929.6250
6418.3281
6150.9087
6709.8501
6197.2666
6763.4736
6466.6338
5949.1470
5905.1582
6382.4106
6108.9355
6237.5356
6503.6372
5993.4463
6625.7617
Herceptin_002
#
155
RT:
5.99
AV:
1
NL:
7.46E4
T:
FTMS+ pNSI sid=200.00 Fullms21000.00@hcd100.00 [500.00-15000.00]
300
3500
4000
450
5000
5500
6000
6500
7000
7500
8000
8500
9000
9500 10000
m/z
0
20
40
60
80
100
RelativeAbundance
6176.64 6445.20
6738.10
5929.65
7066.82
5702.05
7416.13
8722.16 8994.36
3665.64
8243.49
7832.07
3403.63
5315.05
3972.59
9587.71
5044.33
G0 / G0F
G0F / G0F
G1F / G0F
G1F / G1F; G2F / G0F
G1F / G2F
G2F / G2F
FIGURE 6. HCD spectrum
assembly of the 14-mer t
fragmentation step (13-m
monomer signals.
GroEL_130904124520
#
78
RT:
3.82
AV:
1
NL:
3.72E4
T:
FTMS + p NSI sid=30.00 Full ms2 1000.00@hcd200.00 [350.00-50000.00]
2000
4000
6000
8000
10
0
10
20
30
40
50
60
70
80
90
100
Relative Abundance
3814.0713 5200.3672
6355.9844 8171.4683 9534.39
monomer
2000
4000
6000
8000
10
0
10
20
30
40
50
60
70
Relative Abundance
9109.9678
3178.4659 4401.0510
1012
7947.3137
6357.0738
Application of elevated frag
fragmentation of the assem
first fragment, the 13-mer b
reaching up to the upper m
while the monomer signals
the spectrum at the same ti


