3
Thermo Scientific Poster Note
•
PN-64092-ASMS-EN-0614S
Waters_mAb_100C
#
193-233
RT:
8.54-9.49
AV:
41
NL:
2.38E6
T:
FTMS+pESIsid=80.00 Fullms [1500.00-4000.00]
2200
2300
2400
2500
2600
2700
2800
2900
3000
3100
3200
3300
3400
m/z
0
5
10
15
20
25
30
35
40
45
50
55
60
65
70
75
80
85
90
95
100
RelativeAbundance
2748.87
2650.71
2698.89
2604.21
2800.78
2751.88
2559.38
2854.54
2803.79
2556.53
2515.96
2910.54
2857.76
2913.66
2513.31
2968.72
2971.95
2474.17
2471.36
3092.41
3032.59
3158.06
2436.20
3154.66 3161.33 3226.77
2319.52 2358.98
2283.56
3164.85
3295.13 3373.77
waters_mab_rosa_285c
#
168-199
RT:
8.61-9.59
AV:
32
NL:
4.70E4
T:
FTMS+pESIsid=80.00 Fullms [1500.00-4000.00]
2200
2300
2400
2500
2600
2700
2800
2900
3000
3100
3200
3300
3400
m/z
0
5
10
15
20
25
30
35
40
45
50
55
60
65
70
75
80
85
90
95
100
RelativeAbundance
2604.27
2650.80
2559.39
2653.55
2516.02
2698.93
2513.17
2745.75
2473.81
2701.84
2748.81
2433.54
2797.63
2800.76
2431.03
2803.77
2854.61
2391.89
2857.58
2353.78
2321.92
2215.98
2910.20
3091.88
2943.52
3158.17
2976.55
3389.29
3265.51
waters_mab_225c
#
186-223
RT:
8.82-9.74
AV:
38
NL:
1.02E6
T:
FTMS+pESIsid=80.00 Fullms [1500.00-4000.00]
2200
2300
2400
2500
2600
2700
2800
2900
3000
3100
3200
3300
m/z
0
5
10
15
20
25
30
35
40
45
50
55
60
65
70
75
80
85
90
95
100
RelativeAbundance
2698.92
2650.74
2604.14
2748.89
2559.36
2556.54
2701.91
2515.98
2800.66
2751.79
2513.20
2854.53
2474.06
2857.54
2433.55
2910.54
2913.75
2394.38
2971.90
2354.23
3029.09
2215.49
3092.13 3154.75 3223.57
2297.37
3317.55
waters_mab_225c
#
181-216
RT:
8.67-9.53
AV:
36
NL:
1.07E6
T:
FTMS+pESIsid=80.00 Fullms [1500.00-4000.00]
2200
2300
2400
2500
2600
2700
2800
2900
3000
3100
3200
3300
3400
m/z
0
5
10
15
20
25
30
35
40
45
50
55
60
65
70
75
80
85
90
95
100
RelativeAbundance
2698.92
2650.74
2604.14
2748.89
2559.36
2556.54
2701.91
2515.98
2800.66
2751.79
2513.20
2854.53
2474.06
2857.54
2433.55
2910.54
2913.75
2394.38
2971.90
2354.22
3029.09
2215.49
3092.12 3154.75 3223.57
2297.36
3317.55
od coupling capillary LC with
le mass was measured by
ctra of the intact protein were
software. Both Thermo
systems were used for
mAb
alyzed by Thermo Scientific™
ass error and multiple
one sequence coverage for
top-down analysis.
veloped for the detection and
ucial for both safety and
ough characterization is very
lysis of therapeutic mAb, high
S) has become increasingly
various glycoforms,
nal modifications, and
this study, new methods
ss spectrometer were
f an intact mAb.
m Waters) were diluted with
monoclonal antibody was
t 60
C for 30 min prior to top-
ithic columns (200 µm x 25 cm
ass measurement. 0.1%
etonitrile (Solvent B) were
C and the flow rate was 800
was used to elute mAbs from
). For the 1 mm x 5 cm
ient.
m column was used for heavy
g of reduced antibody was
25%B to 40% gradient was
to either an Orbitrap Fusion or
S was used for both antibody
bitrap Elite MS was also used
rameters including ion transfer
ues, AGC target and others
D were performed in separate
. For ETD MS/MS, the
normalized collision energy
y voltage was set to 4kV, the
re was 225
°
C, the S-lens
Resolution was set at 120,000
le maximum IT was set at 250
rotein Deconvolution software
ETD and HCD spectra were
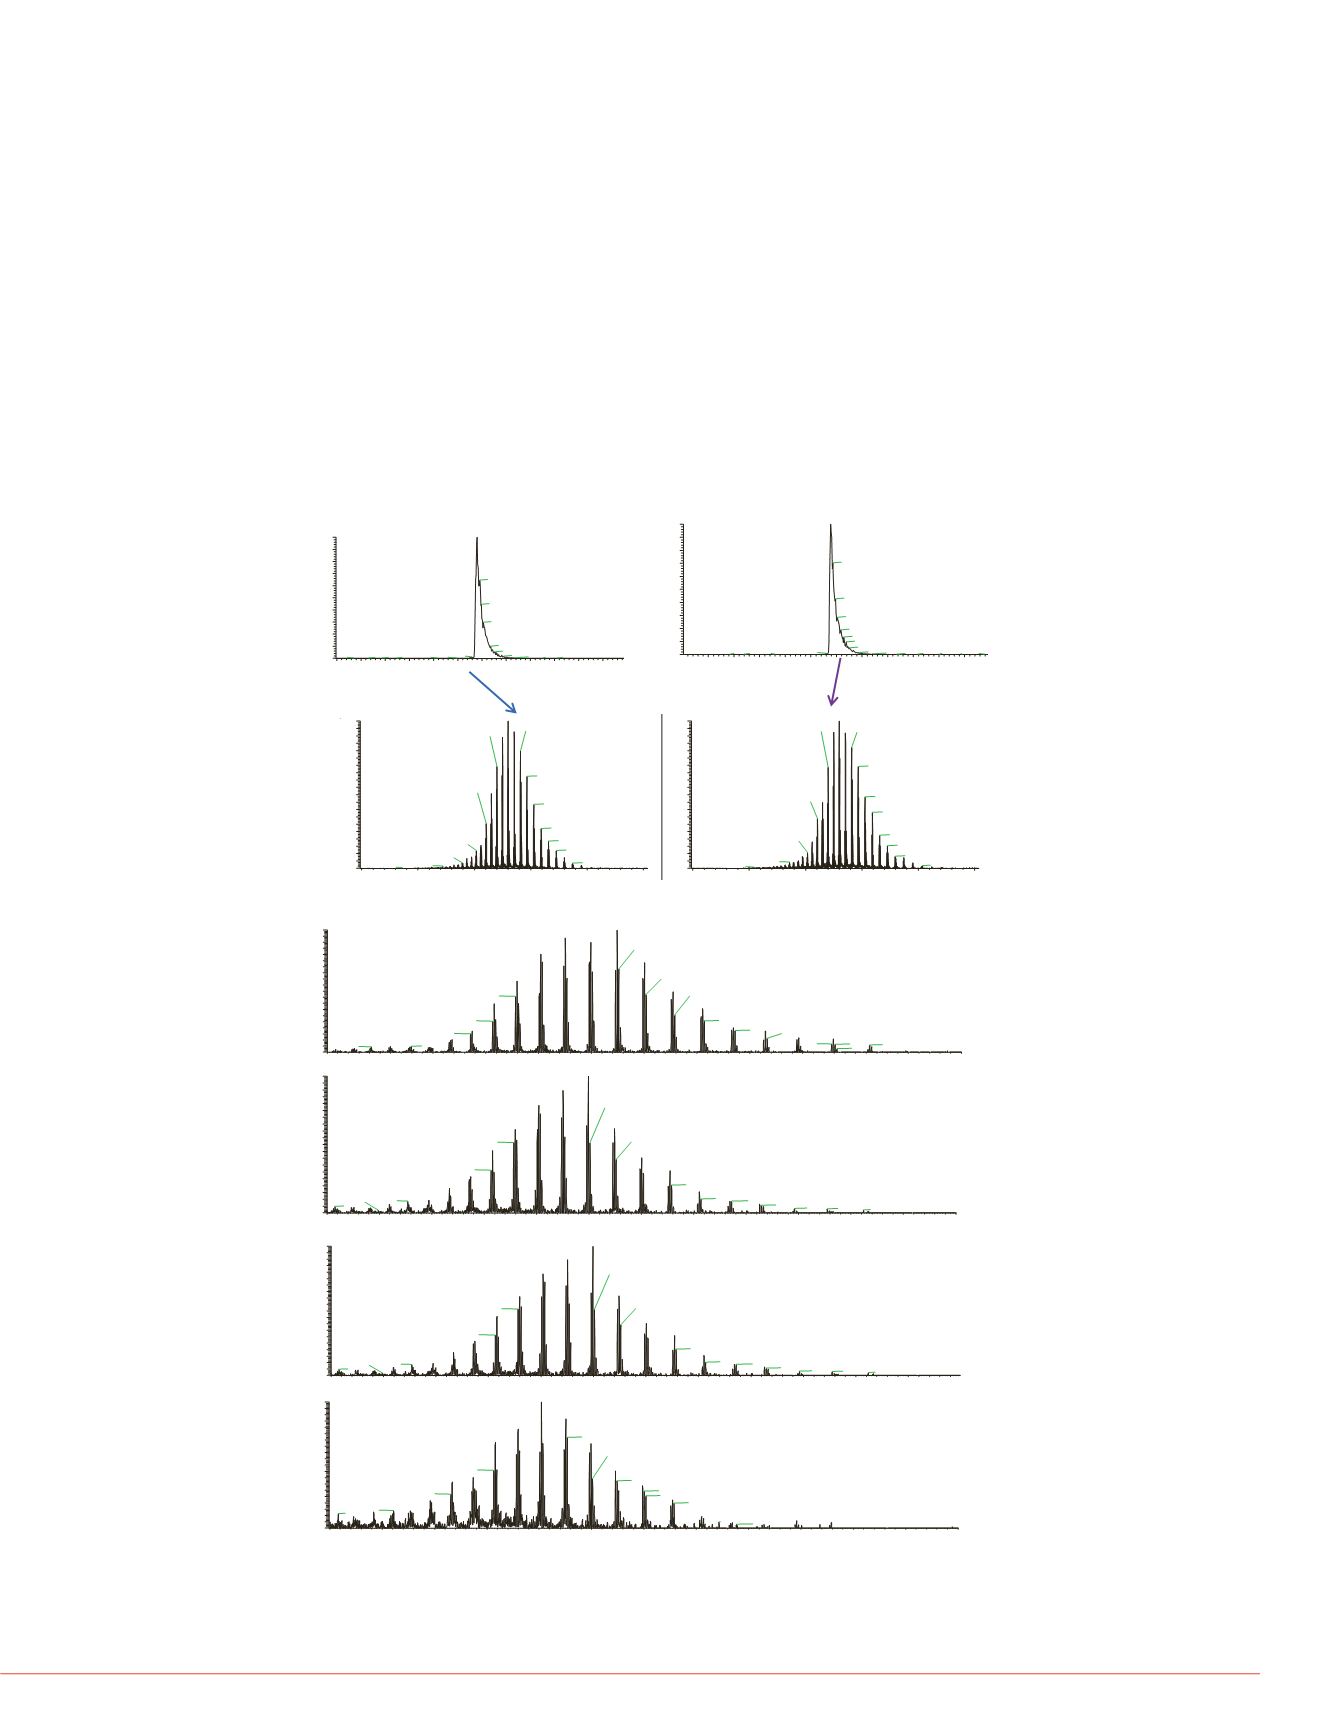
FIGURE 1. Experiment parameter optimization
a) Example mAb analysis under different HCD cell pressure
Results
Intact mAb Mass Measurement
Several mass spectrometer experiment parameters including HCD cell pressure,
source fragmentation energy, AGC target and source heating temperature of the ESI
probe were optimized for intact mAb mass measurement. 4 mTorr and 7 mTorr HCD
cell pressure (Figure 1a), source fragmentation energy of 60 and 100, MS full AGC
target 5e4 and 1e5 were used and the results showed that these parameters had no
significant impact on the intact mAb mass measurement. However, it was found that
the capillary temperature plays a critical role for detection of the intact mAb. Figure 1b
shows the mass spectra for the intact mAb at four capillary temperatures ranging from
100 ºC to 285 ºC As the temperature increased from 100 ºC to 285 ºC, the charge
envelope for the intact mAb moved from higher to lower
m/z
with more than one order
of magnitude sensitivity drop. The mAb also started to show signs of degradation at the
highest temperature. 225 ºC was the temperature that still maintained the intact mAb
and the sensitivity as a operation temperature.
Using the optimized experiment par
to evaluate the reproducibility of the
reproducibility analysis, with the res
100 ng of mAb was then analyzed w
molecular mass was measured with
mAb. All five different glycoforms w
in Figure 3.
FIGURE 2. Reproducibility of mA
X:\2013\...\073013_watermAb_100SID_5e4
7/31/2013 1:45:56 PM
073013_watermAb_100SID_5e4
#
431-475
RT:
11.56-12.51
AV:
45
NL:
3.06E7
T:
FTMS+ pNSIsid=100.00 Fullms [1500.00-4000.00]
1500
2000
2500
3000
3500
4000
m/z
0
5
10
15
20
25
30
35
40
45
50
55
60
65
70
75
80
85
90
95
100
RelativeAbundance
2800.7183
z=?
2910.4874
z=?
2698.9671
z=?
2968.6788
z=?
3029.2443
z=?
2604.2826
z=?
3092.3591
z=?
3158.1089
z=?
3226.8326
z=?
2515.9953
z=?
2391.6792
z=?
3373.3410
z=?
2217.9855
z=?
3808.9230
z=?
1861.9974
z=?
073013_watermab_100ng_100sid_5e4_7mt_afterhmcali2
#
499-535
RT:
11.73-12.51
AV:
37
NL:
2.36E7
T:
FTMS+ pNSIsid=100.00 Fullms [1500.00-4000.00]
1500
2000
2500
3000
3500
4000
m/z
0
5
10
15
20
25
30
35
40
45
50
55
60
65
70
75
80
85
90
95
100
RelativeAbundance
2800.7167
z=?
2910.5257
z=?
2968.6759
z=?
2698.9524
z=?
3029.2735
z=?
3092.3402
z=?
2604.1698
z=?
3158.0747
z=?
3226.7675
z=?
2515.9933
z=?
3294.8918
z=?
2356.2757
z=1
3534.0317
z=?
2041.9296
z=?
3956.3528
z=?
1741.9689
z=?
RT:
6.02 - 17.93
7
8
9
10
11
12
13
14
15
16
17
Time (min)
0
10
20
30
40
50
60
70
80
90
100
RelativeAbundance
11.77
11.86
11.96
12.03
12.16
12.29
12.38
12.51
12.90
11.60
13.44 14.35
6.84 7.43 7.84
10.11
8.39 9.61
15.16
17.78
16.01 16.90
NL:
9.11E7
BasePeak MS
073013_waterma
b_100ng_100sid
_5e4_7mt_afterh
mcali2
RT:
5.96 - 17.96
6
7
8
9
10
11
12
13
14
15
16
17
Time (min)
0
10
20
30
40
50
60
70
80
90
100
RelativeAbundance
11.80
11.91
11.97
12.06
12.36
12.54
12.91
11.58
13.37
10.97
7.00 7.31
6.70
7.87 8.49
14.51
10.15
15.12
17.25
16.13
NL:
1.31E8
BasePeak
MS
073013_wat
ermAb_100
SID_5e4
4mTorr
7mTorr
b) Capillary temperature optimization
100 ºC
285 ºC
225 ºC
150 ºC
073013_watermAb_100ng_100SID_5e4_7mT_AfterHMCali
T:
FTMS + p NSI sid=100.00 Full ms [1500.00-4000.00]
2200
2400
26
0
10
20
30
40
50
60
70
80
90
100
RelativeAbundance
265
2604.35
2559.1827
2516.0429
2394.3248
2282.9627
2122.4222
073013_watermab_100ng_100sid_5e4_7mt_afterhmcali2
T:
FTMS + p NSI sid=100. Full ms [150 .00-4000.00]
2000
2200
2400
26
0
10
20
30
40
50
60
70
80
90
100
RelativeAbundance
265
2604.1
2559.3345
2515.9948
2436.1442
2280.6532
2116.1554
073013_watermab_100ng_100sid_5e4_7mt_afterhmcali3
T:
FTMS + p NSI sid=100.00 Full ms [1500.00-4000.00]
2200
2400
26
0
10
20
30
40
50
60
70
80
90
100
RelativeAbundance
265
2604.34
2559.3597
2516.0477
2394.3595
2248.8929
Run 1
Run 2
Run 3
073013_watermAb_100SID_5e4
#
435-483
RT:
11.65-12.69
AV:
49
NL:
2.87E7
T:
FTMS+pNSIsid=100.00 Fullms [1500.00-4000.00]
1600
1800
2000
2200
2400
0
5
10
15
20
25
30
35
40
45
50
55
60
65
70
75
80
85
90
95
100
RelativeAbundance
255
2474.1815
z=?
2356.2779
z=?
2217.9866
z=?
2080.4507
z=?
1928.6060
z=?
1761.9384
z=?
1623.7610
z=?
073013_watermAb_100SID_5e4
#
430-489
RT:
11.54-12.82
AV:
60
NL:
T:
FTMS+pNSIsid=100.00 Fullms [1500.00-4000.00]
2690
2700
2710
2720
2730
0
5
10
15
20
25
30
35
40
45
50
55
60
65
70
75
80
85
90
95
100
RelativeAbundance
2698.9641
z=?
2695.9974
z=?
2701.8272
z=?
2704.7705
z=?
2692.2985
z=?
2707.8087
z=?
2713.6711
z=? 2723.5032
z=?
7 ppm
FIGURE 3. mAb mass measurem
on PepSwift column.
TIC
Average Spectrum of
Intact mAb Charge Envelope
TIC


