3
Thermo Scienti c Poster Note
•
PN HUPO13_POS-02-200_MBromirski
_E 09/13S
Methods
Sample Preparation
Carbonic Anhydrase, Herceptin and Pyruvate Kinase are
commercially available and were purchased from Sigma-
Aldrich, Germany. GroEL samples were provides by the
laboratory of Prof. Dr. Albert Heck, Utrecht, The
Nehterlands. All samples were desalted prior
measurement using Bio-Rad™ Micro BioSpin™ columns,
following the instructions of the BioSpin column manual.
Desalting changed any storage buffer system to 5 µM
ammonium acetate buffer, pH 6.8 ± 0.2.
Sample introduction
Samples were introduced using an Advion TriVersa
NanoMate with chip based nanospray ionization in
positive mode, using an Advion nozzle chip with an
internal spray nozzle diameter of 5 µm. According to the
manufacturer’s specifications this should result in a
sample flow of approx. 100 nL/min.
Mass Spectrometry
All analyses were carried out on a Thermo Scientific
Exactive Plus EMR mass spectrometer. Detection
parameters were set according to the type of analyte
measured.
Data Analysis
Deconvolution of signals measured for determination of
molecular masses of the analytes were carried out using
ProteinDeconvolution 2.0 SP2 software.
for characterization and qu
could achieve a clear basel
of the major glycoforms kn
present interfering adducts
enough to separate them fr
correct mass assignment c
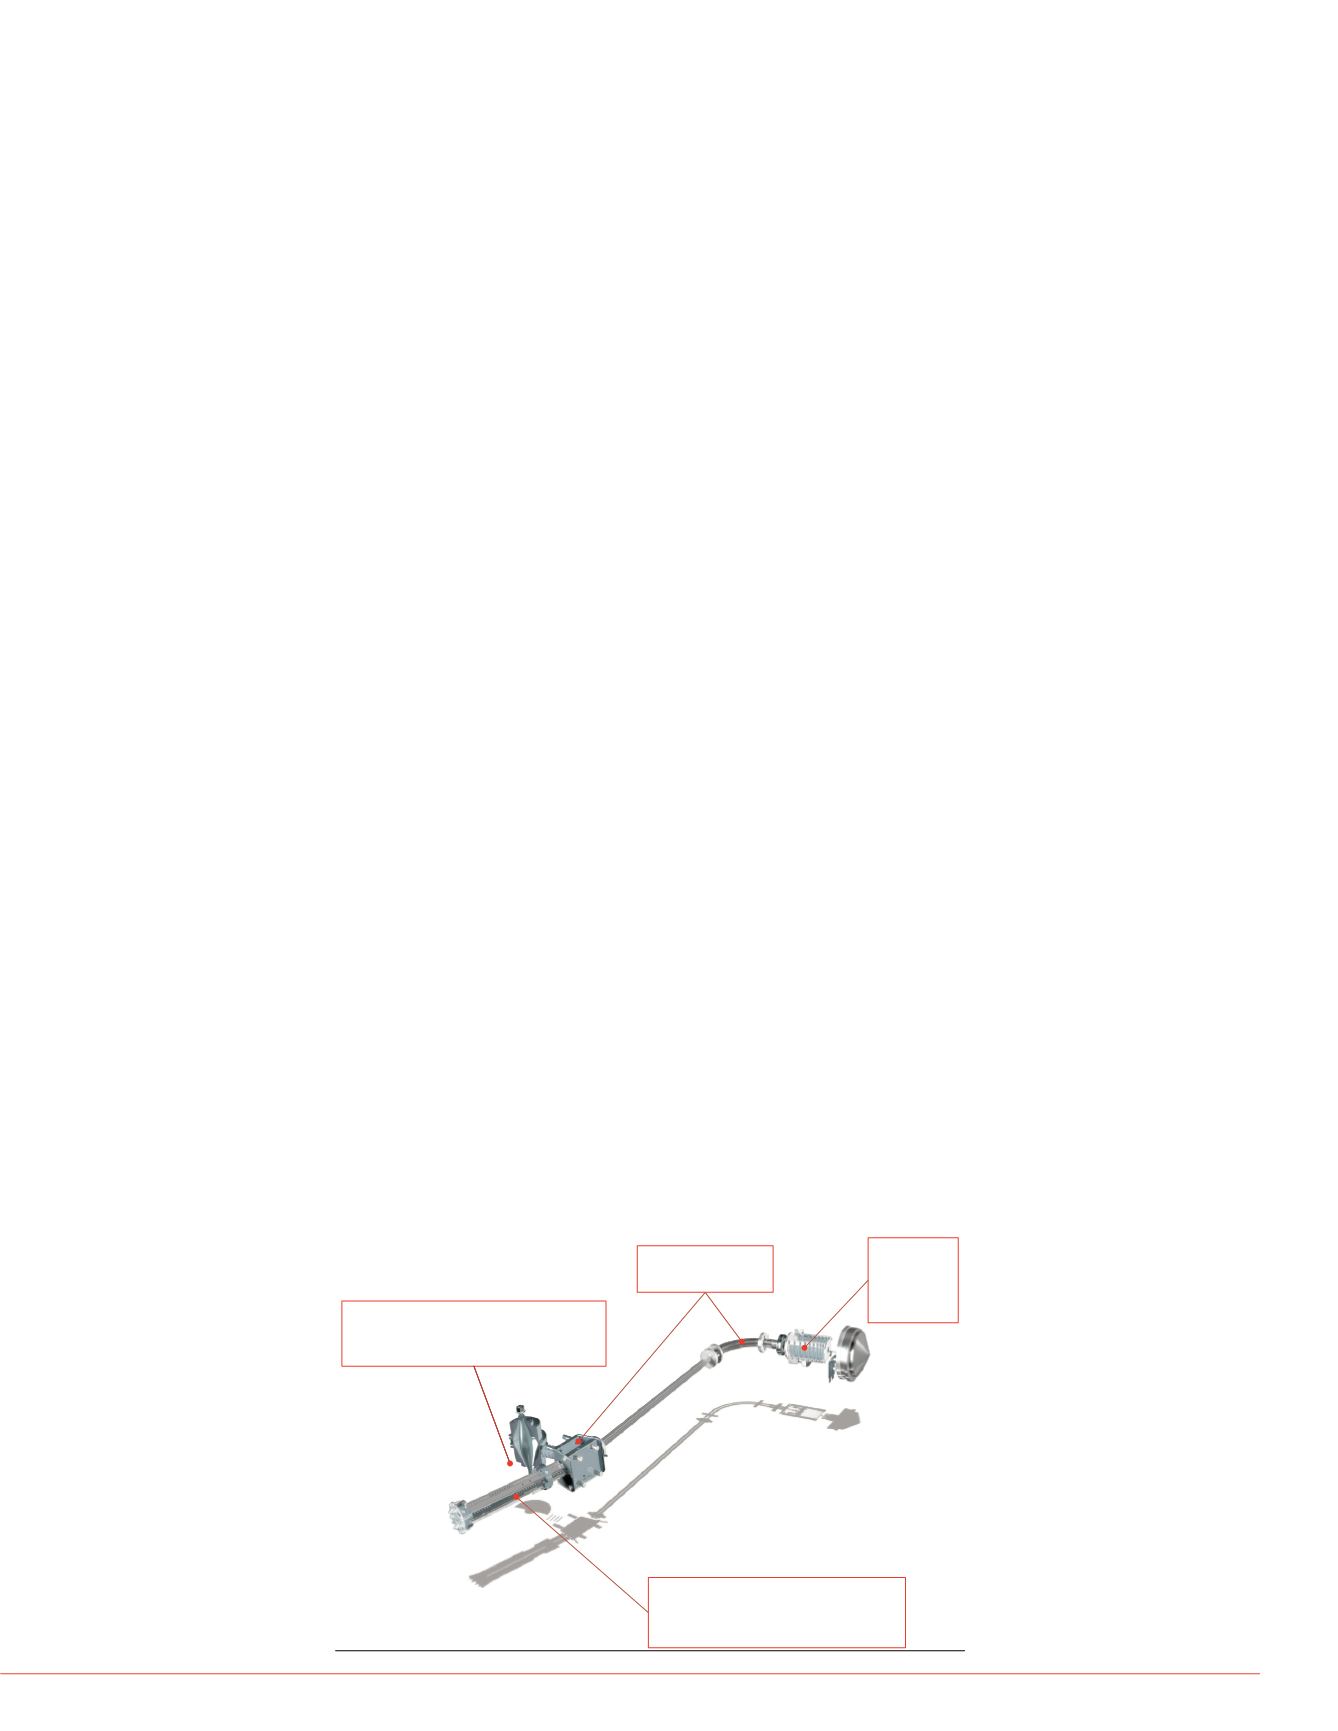
HCD Trapping
Automated HCD Gas Control via
instrument control SW
Better High Mass
Transmission
Applying
in-source
dissociation
energy
Extended Mass range up to 20,000
m/z
Modified Preamplifier
32 ms transient available
FIGURE 1. Improved ion path in the Exactive Plus EMR
mass spectrometer
Pyruvate Kinase
In native state Pyruvate kin
assembly of intermediate si
appeared as a strong signa
desolvation of the molecule
full pattern of isoform comb
Upon slight application for f
monomeric subunits with th
together with the full asse
amu is clearly visible in the
subunit as well as the multi
the tetrameric complex.
FIGURE 3. Experimental
of Herceptin, showing cl
and even resolving small
mass accuracy if not res
Herceptin_002
#
164
RT:
6.53
AV:
1
NL:
7.06E4
T:
FTMS+ pNSI sid=200.00 Fullms21000.00@hcd100.00 [500.00-15000.00]
5800
5900
6000
6100
6200
0
20
40
60
80
100
RelativeAbundance
6176.6475
5929.6250
6150.9087
6197.26
5949.1470
5905.1582
6108.9355
6
5993.4463
Herceptin_002
#
155
RT:
5.99
AV:
1
NL:
7.46E4
T:
FTMS+ pNSI sid=200.00 Fullms21000.00@hcd100.00 [500.00-15000.00]
300
3500
4000
450
5000
5500
600
0
20
40
60
80
100
RelativeAbundance
6
5929.6
5702.05
3665.64
3403.63
5315.05
3972.59
5044.33
G0 / G0F
G0F / G0F


