8
Analysis of Intact Macromolecular Assemblies On A Bench Top Orbitrap MS System
Conclusion
With a Thermo Scientific Exactive Plus EMR mass
spectrometer proteins easily can be studied in their native
state, revealing the accurate mass of the fully active protein
complex as well as clear separation of isoforms and
conjugates. Large protein assemblies can be fragmented
down to significant sub-assemblies and monomers for in-
detail evaluation of quarternary structures.
For small proteins up to 35 kDa isotopic resolution can be
achieved for determination of the monoisotopic mass.
Larger proteins show clear separated signals for isoforms
and conjugates. Acquisition time per compound lies in the
rang of seconds.
Sample introduction with the Advion TriVersa NanoMate
proved to be easy to handle, providing reproducible and
stable spray conditions for best quality spectra acquired
with minimum time consumption. It allows for automated
data acquisition for maximum sample throughput.
Acknowledgements
We would like to thank Professor Albert Heck and his group
from the University of Uthrecht, The Netherlands, for
supplying samples of E. coli GroEL.
ancer treatment.
tatus is important
For Herceptin, we
on and assignment
3). In addition,
olved clearly
ody signal, so a
eved.
Advion, TriVersa and NanoMate are trademarks of Advion Inc., Ithaca, NY, USA. Bio-Rad and BioSpin are trademarks
of Bio-Rad Laboratories, Inc, Hercules, CA, USA. All other trademarks are the property of Thermo Fisher Scientific and
its subsidiaries.
This information is not intended to encourage use of these products in any manners that might infringe the intellectual
property rights of others.
Presented at HUPO 2013
meric protein
protein assembly
trum and due to full
s spectrometer the
isible (see fig. 4).
n energy the
attern are visible
ss difference of 324
d spectra of the
rm combinations for
oluted spectrum
n of glycoforms
which would affect
6500
6600
6700
6800
807
6738.1323
6709.8501
6763.4736
6466.6338
6503.6372 6625.7617
0
8000
8500
9000
9500 10000
3
8722.16 8994.36
8243.49
7832.07
9587.71
F / G0F
G1F / G2F
G2F / G2F
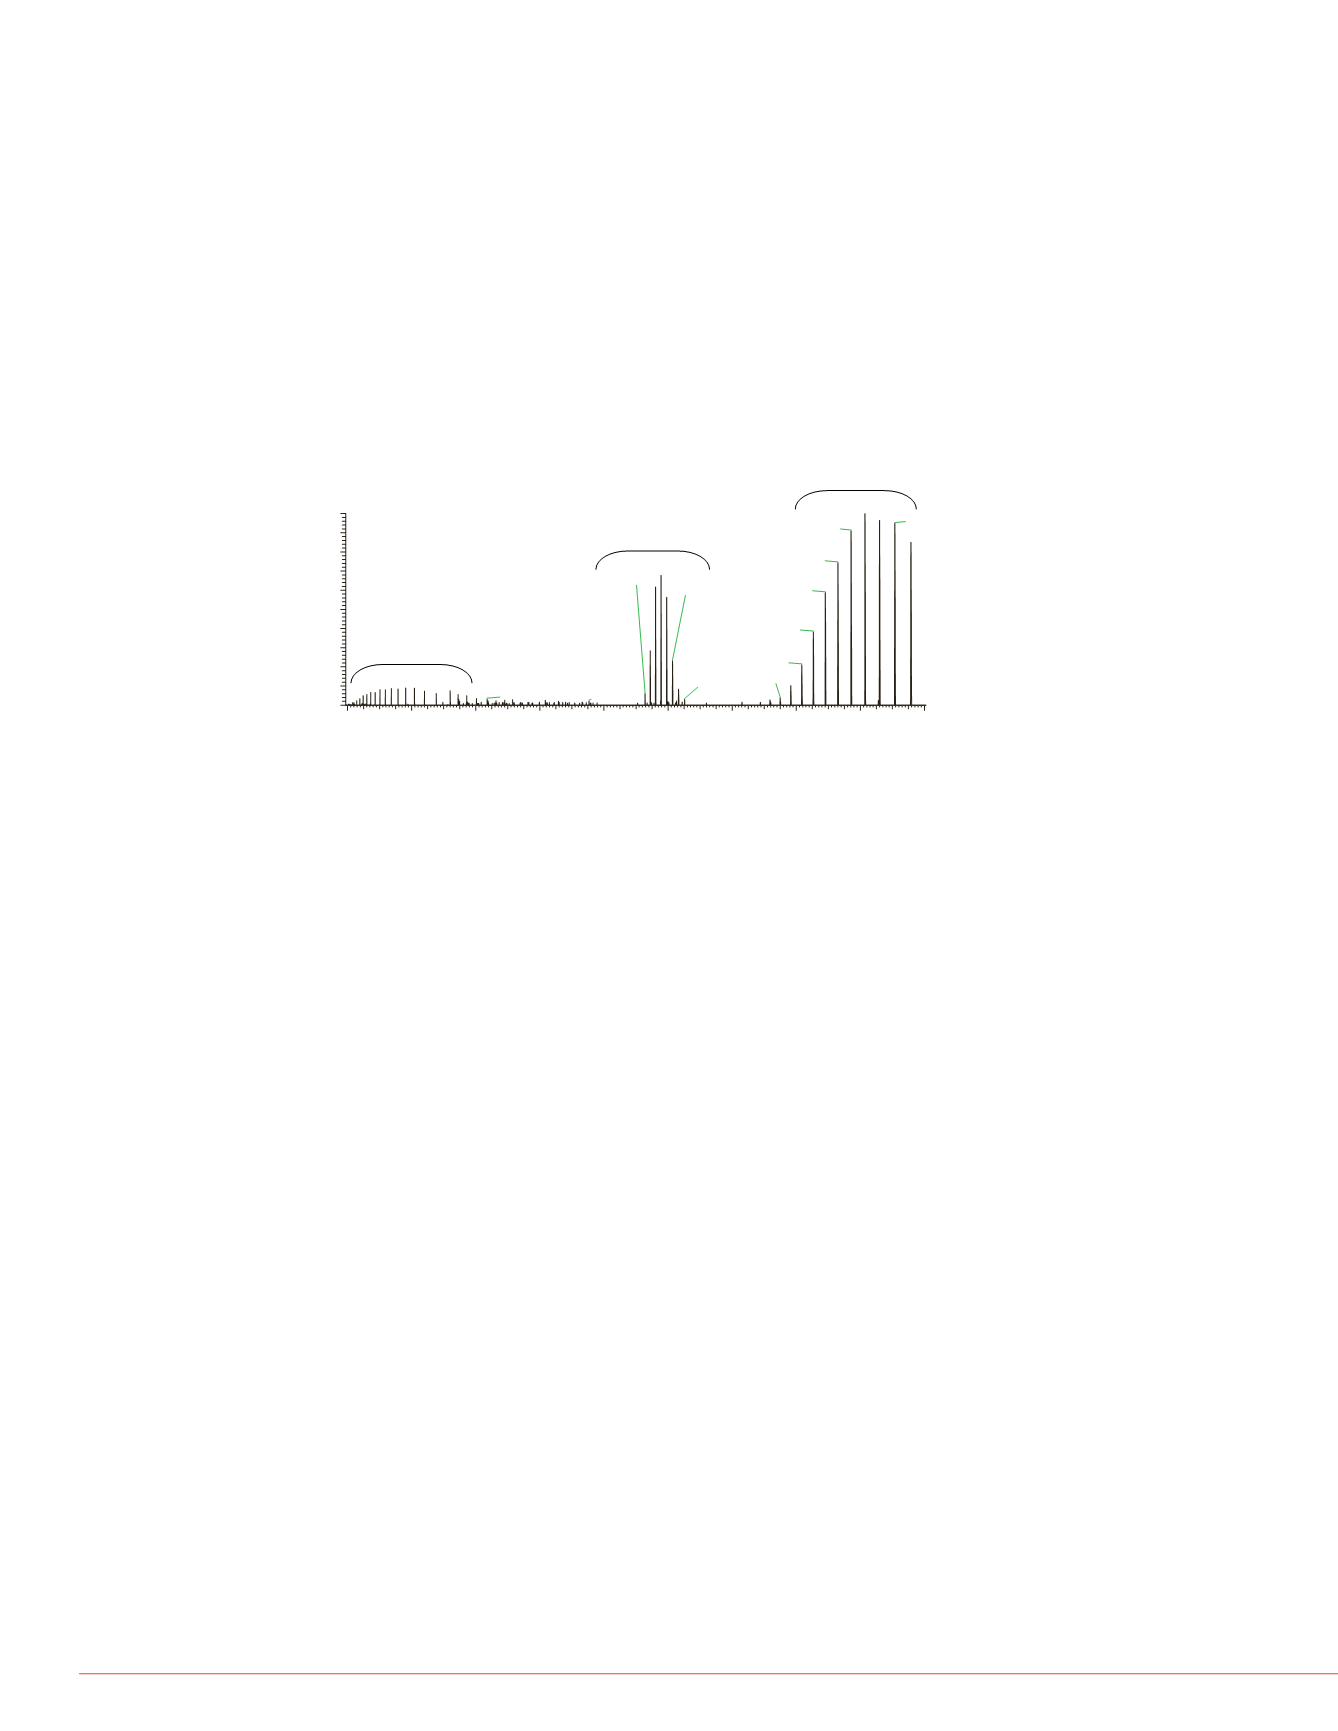
FIGURE 6. HCD spectrum of GroEL, showing the full
assembly of the 14-mer together with the first
fragmentation step (13-mer) and the according
monomer signals.
GroEL_130904124520
#
78
RT:
3.82
AV:
1
NL:
3.72E4
T:
FTMS + p NSI sid=30.00 Full ms2 1000.00@hcd200.00 [350.00-50000.00]
2000
4000
6000
8000
10000
12000
14000
16000
18000
20000
m/z
0
10
20
30
40
50
60
70
80
90
100
Relative Abundance
18144.6387
19075.1426
17712.0508
17300.7129
11781.2871
16906.7754
16531.5195
12138.6221
16171.4043
3814.0713 5200.3672
11282.4102
15497.3105
6355.9844
12516.9492
8171.4683 9534.3906
14306.0518
monomer
14-mer
13-mer
m/z
Application of elevated fragmentation energy lead to
fragmentation of the assembly. The charge envelop of the
first fragment, the 13-mer became the dominant signal
reaching up to the upper mass range limint of
m/z
20000,
while the monomer signals were visible at the lower end of
the spectrum at the same time (see fig 6).


