6
Intact Mass Analysis of Monoclonal Antibody (MAb) Charge Variants Separated Using Linear pH Gradient
Conclusions
• A linear pH gradient from pH 5.6 to pH 10.2 was generated using a multi-component
zwitterionic buffer system on a cation-exchange column.
• A linear pH gradient separation platform enables high resolution, fast and rugged MAb
charge variant analysis and automation of method optimization.
• The combination of off-line IEC separation and on-line LC mass spectrometry
detection provides an efficient way to obtain structural information of MAb variants.
References
1. Farnan, D and Moreno, T. Multiproduct high-resolution monoclonal antibody charge
variant separations by pH gradient ion-exchange chromatography.
Anal. Chem.,
2009,
81, 8846–57.
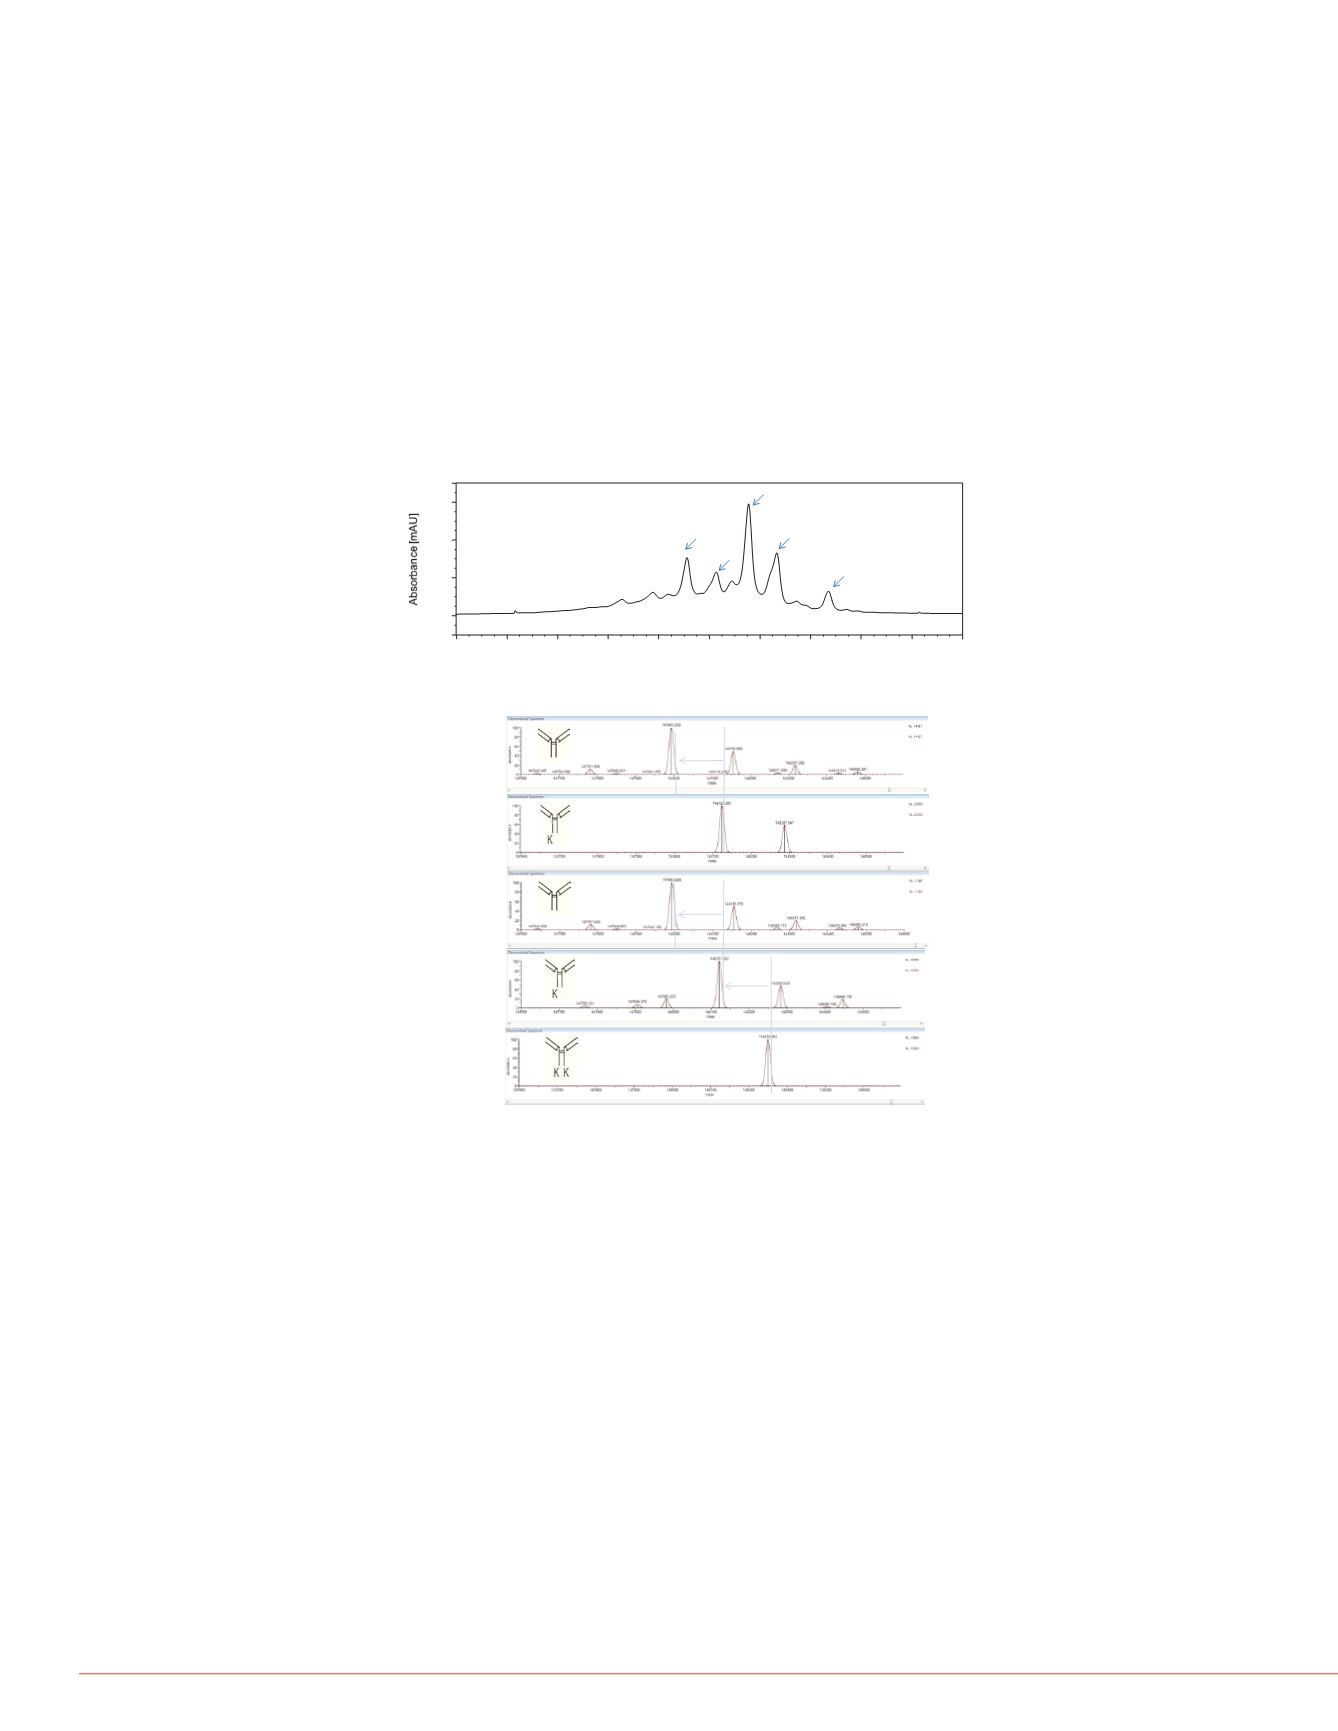
FIGURE 6. Deconvoluted MS Spectra.
Intact Mass of MAb variants
An IgG sample was purified from harvest cell culture using the Protein A bead. This
sample was analyzed via linear pH gradient and the fractions were collected via a time-
based method (Figure 5). Major fractions collected off the pH gradient were analyzed on
a Q Exactive mass spectrometer. On-line desalting using a reversed-phase monolithic
column was carried out prior to MS detection. Figure 6 showed the deconvoluted mass
spectra of peak 1, 2, 3, 4, and 5. The deconvoluted spectra showed that the major
component in Peak 1 has a
m/z
at 147993. Adjacent peaks at
m/z
148155 and 148317
correspond to different glycoforms with 1 and 2 additional hexoses. The major
component in peak 2 has a
m/z
at 148121. The delta mass between Peak 1 and Peak 2
is 128 amu, corresponding to one lysine. The deconvoluted spectra of Peak 3 and peak
4 have the same MS profile as Peak 1 and Peak 2, suggesting they are structural
isomers. The major component in Peak5 has a
m/z
at 148250. The delta mass between
Peak 4 and Peak 5 is 129 amu. These data suggest that Peak 3 and Peak 4 correspond
to lysine truncation variants of Peak 5.
riant separation by linear pH gradient.
c SCX-10, 10 µm, 4
×
250 mm column.
) to 100% B (pH 10.2), gradient method
gradient, 0% B (pH 5.6) to 50% B (pH 7.9);
.75) to 50% B (pH 7.9).
All trademarks are the property of Thermo Fisher Scientific and its subsidiaries. This information is not intended to
encourage use of these products in any manners that might infringe the intellectual property rights of others.
0
25
30
35
40
5.00
6.00
7.00
8.00
9.00
10.50
Time [min]
pH trace
20
25
30
35
40
5.00
6.00
7.00
8.50
Time [min]
pH trace
0
25
30
35
40
6.60
7.00
7.25
7.50
7.75
8.00
ime [min]
pH trace
Variants
to 10. Our pH gradient separation method
eparation. Using a full range of pH gradient
pH elution range in the initial run (Figure 4a)
in. Further optimization of separation can
H gradient in a narrower pH range. Figure
.6 to pH 7.9 with pH gradient slope at 0.076
n profile from pH 6.75 to pH 7.9 with pH
traces in Figure 4a, 4b, and 4c
linear when the slope was reduced to ½ or
variants were predictable when running a
hromatogram shown in Figure 4b and 4c can
t-acquisition script using the MAb variant pH
tial run (Figure 4a). This example illustrates
tion platform, which is to simplify and
charge variant separation.
FIGURE 5. pH gradient separation of purified IgG on a ion-exchange column.
The
separation was carried out on a MAbPac SCX-10, 10 µm, 4
×
250 mm column via a
30 min linear pH gradient from 40% B (pH 6.52) to 80% B (pH 9.28
-Lys
Peak 1
Peak 2
Peak 3
Peak 5
Peak 4
-Lys
-Lys
8.0
10.0 12.0 14.0 16.0 18.0 20.0 22.0 24.0 26.0 28.0
-5.0
10.0
20.0
35.0
Retention Time [min]
3
4
5
1 2


