4
Intact Mass Analysis of Monoclonal Antibody (MAb) Charge Variants Separated Using Linear pH Gradient
employing a multi-component buffer system
ecies with pI values ranging from 6 to 10.
nt B was titrated to pH 10.2. In this pH range,
r negatively charged. Therefore they were not
tionary phase and served as good buffers for the
le 1, six proteins with a range of pI values from
MAbPac SCX-10, 10 µm, 4
×
250 mm column.
ee isoforms, lectin-1, lectin-2, and lectin-3),
chrome C. The chromatogram was shown in
experiment as a function of time was plotted in
lly linear from pH 5.6 to pH 10.2 over a 30
t value R
2
was 0.9996.
t there is a correlation between the elution pH for
es of the protein components. Figure 3 is a
es for six protein component peaks in Figure 1
lues. The measured pH values for the six protein
ar correlation to the literature based pI values.
example supports the fact that linear regression
ibed here can be used to estimate the pI of a
etention time and measured pH.
d for the MAbPac SCX-10, 10 µm, 4
×
250
run time is 40 min. The linear pH range covers
was set at 280 nm.
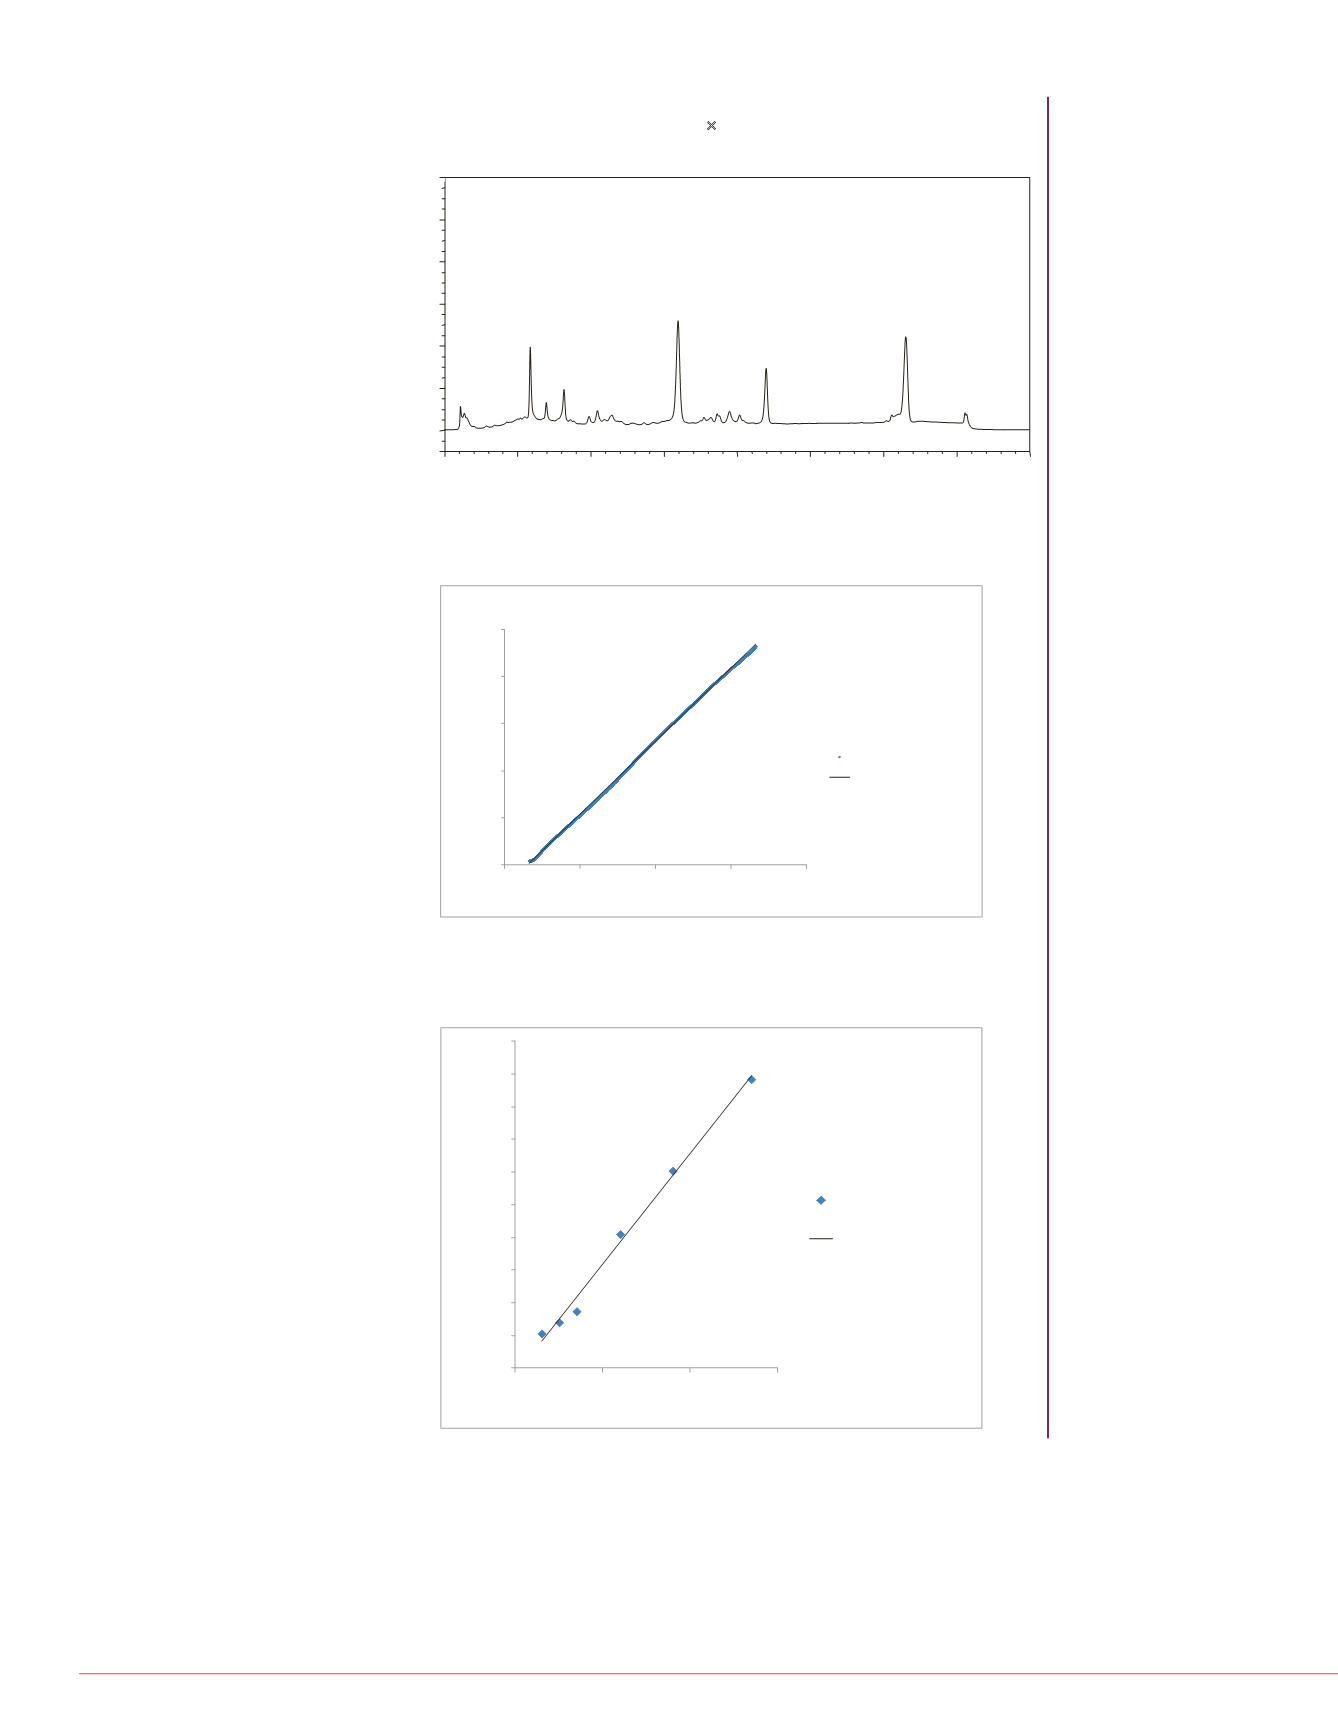
FIGURE 1. Chromatogram of six proteins separated on a 30-min linear pH
gradient on a MAbPac SCX-10, 10 µm, 4
×
250 mm column.
Protein name,
retention time, and corresponding pH values are labeled for each protein peak.
FIGURE 3. A graph plotting the measured pH values for six protein component
peaks as a function of the corresponding pI value.
The measured pH values of all
six components were exported from the same experiment shown in Figure 1.
y running linear gradient from 100% eluent A
r pH gradient analysis carried out on the
cation-exchange columns, the gradient
er stated.
y = 0.1548x + 5.0404
R²= 0.9996
5.5
6.5
7.5
8.5
9.5
10.5
0
10
20
30
40
Measured pH value
Retention Time [min]
Measured pH
Linear(Measured pH)
FIGURE 2. A graph showing measured pH values as a function of time.
The
measured pH values were exported from the same experiment shown in Figure 1.
The measured pH values are labeled using blue diamond shape.
Lectin-1
Lectin-2
Lectin-3
Trypsinogen
Ribonuclease A
Cytochrome C
y = 1.6923x - 7.2914
R² = 0.9929
5.5
6
6.5
7
7.5
8
8.5
9
9.5
10
10.5
7.5
8.5
9.5
10.5
Measured pH value
pI value
Measured pH value
Linear (Measured pH
value)
FIGURE 4. An example of MAb cha
The separation was carried out on a
(a) Separation by pH gradient, 0% B
was shown in Table 1; (b) Separation
(c) Separation by pH gradient, 25%
0
5
10
15
20
25
30
35
40
-5.0
10.0
20.0
30.0
40.0
50.0
60.0
Absorbance [mAU]
Retention Time [min]
Lectin-1 - 5.87 - 6.04
Lectin-2 - 6.97 - 6.20
Lectin-3 - 8.18 - 6.37
Trypsinogen -15.97 - 7.55
RibonucleaseA- 22.00 - 8.53
Cytochrome C - 31.55 - 9.93
0
5
10
15
-5.0
10.0
20.0
30.0
40.0
Absorbance [mAU]
(a)
0
5
10
15
-5.0
0.0
10.0
20.0
25.0
Absorbance [mAU]
R
(b)
0
5
10
15
-2.0
5.0
10.0
16.0
Absorbance [mAU]
R
(c)
ification, 1 mL of IgG was purified from
Pierce Protein A beads. The protein
g/mL. About 33 µL of the purified IgG was
, 4
×
250 mm column and separated via linear
e column was equilibrated at 40% B. Three
radient was run from 40% to 100% B in 30
96-well plate at a rate of 0.2 min per fraction
ntific™ ProSwift™ RP-10R monolithic column
solvents were 0.1% formic acid in H
2
O (Solvent
Solvent B). Column was heated to 50 ºC during
r injection of MAbs, a 5 min gradient from 10% B
om the column.
trometer was used for this study. Intact MAb was
r mass. The spray voltage was 4kV. Sheath gas
w rate was set at 5. Capillary temperature was
urce CID was set at 45 eV. Resolution was
for full scan. Maximum IT was set at 200 ms.
ct MAbs were analyzed using Thermo
oftware that utilizes the ReSpect algorithm for
ectra for deconvolution were produced by
dant portion of the elution profile for the MAb.
ly deconvoluted using an input m/z range of 2000
40000 to 160000 Da, a target mass of 150000 Da,
tive charge states from the input m/z spectrum to
pH Gradient Separation Platform f
Most MAbs have pI values in the ran
can serve as a platform for charge v
from pH 5.6 to pH 10.2, we establish
with a pH gradient slope of 0.153 pH
simply be achieved by running a shal
4b showed the separation profile fro
pH unit/min. Figure 4c showed the s
gradient slope at 0.038 pH unit/min.
demonstrated that the pH gradient m
¼ of the initial run.
Because the chromatographic profile
shallower pH gradient. Pump method
be automatically generated by writing
elution range information collected in
the advantages of using pH gradient
automate the method development f
%A
%B
100
0
100-0
0-100
0
100
100
0


