7
Thermo Scienti c Poster Note
•
PN HUPO13_POS-02-200_MBromirski
_E 09/13S
cancer treatment.
status is important
l. For Herceptin, we
tion and assignment
. 3). In addition,
solved clearly
ibody signal, so a
ieved.
GroEL
The chaperone protein GroEL from E. coli belongs to the
group large proteins with a mass of roughly 800 kDa of the
fulllyactive 14-mer complex. With proteins of this size, the
resolving power of the MS instrumentation becomes a
minor part for successful resolution of isoforms and
conjugates, but desolvation capabilities are the limiting
factor. With GroEL we could achieve full desolvation
resulting in sharp baseline separation of the different
charge states (see fig. 5).
chieved.
3500
3600
3700
3800
3900
3636.9632
3674.8277
3581.9352
3850.5058
3514.7714
3722.6411
42-0.93
AV:
18
NL:
9.56E4
0.00@hcd100.00 [500.00-20000.00]
2909.2
2909.4
2909.6
2909.8
2910.0
2910.2
2910.4
2910.6
2910.8
2911.0
m/z
2909.7735
2909.6750
2909.8761
2909.5724
2910.0743
2909.4731
2909.3744
2910.1769
2910.2755
2909.2716
09.1734
2910.3762
2910.5759
2910.6776
2910.8742
2910.9758
voluted spectrum
ion of glycoforms
which would affect
5.1807
7500
8000
8500
9000
9500 10000
6.13
8722.16 8994.36
8243.49
7832.07
9587.71
s to a mass of
c containing
069.6034, relating to
FIGURE 6. HCD spectrum of GroEL, showing the full
assembly of the 14-mer together with the first
fragmentation step (13-mer) and the according
monomer signals.
GroEL_130904124520
#
78
RT:
3.82
AV:
1
NL:
3.72E4
T:
FTMS + p NSI sid=30.00 Full ms2 1000.00@hcd200.00 [350.00-50000.00]
0
10
20
30
40
50
60
70
80
90
100
Relative Abundance
18144.6387
19075.1426
17712.0508
17300.7129
11781.2871
16906.7754
16531.5195
12138.6221
16171.4043
3814.0713 5200.3672
11282.4102
15497.3105
6355.9844
12516.9492
8171.4683 9534.3906
14306.0518
monomer
14-mer
13-mer
GroEL
#
124-130
RT:
11.29-12.03
AV:
7
NL:
9.95E5
T:
FTMS + p NSI sid=30.00 Full ms2 1000.00@hcd100.00 [350.00-50000.00]
2000
4000
6000
8000
10000
12000
14000
16000
18000
20000
m/z
0
10
20
30
40
50
60
70
80
90
100
Relative Abundance
11615.9034
12144.7492
12525.9887
11130.9029
19582.3249
9109.9678
12927.4829
3178.4659
17420.9942
4401.0510
16254.9250
10123.2409
7947.3137
6357.0738
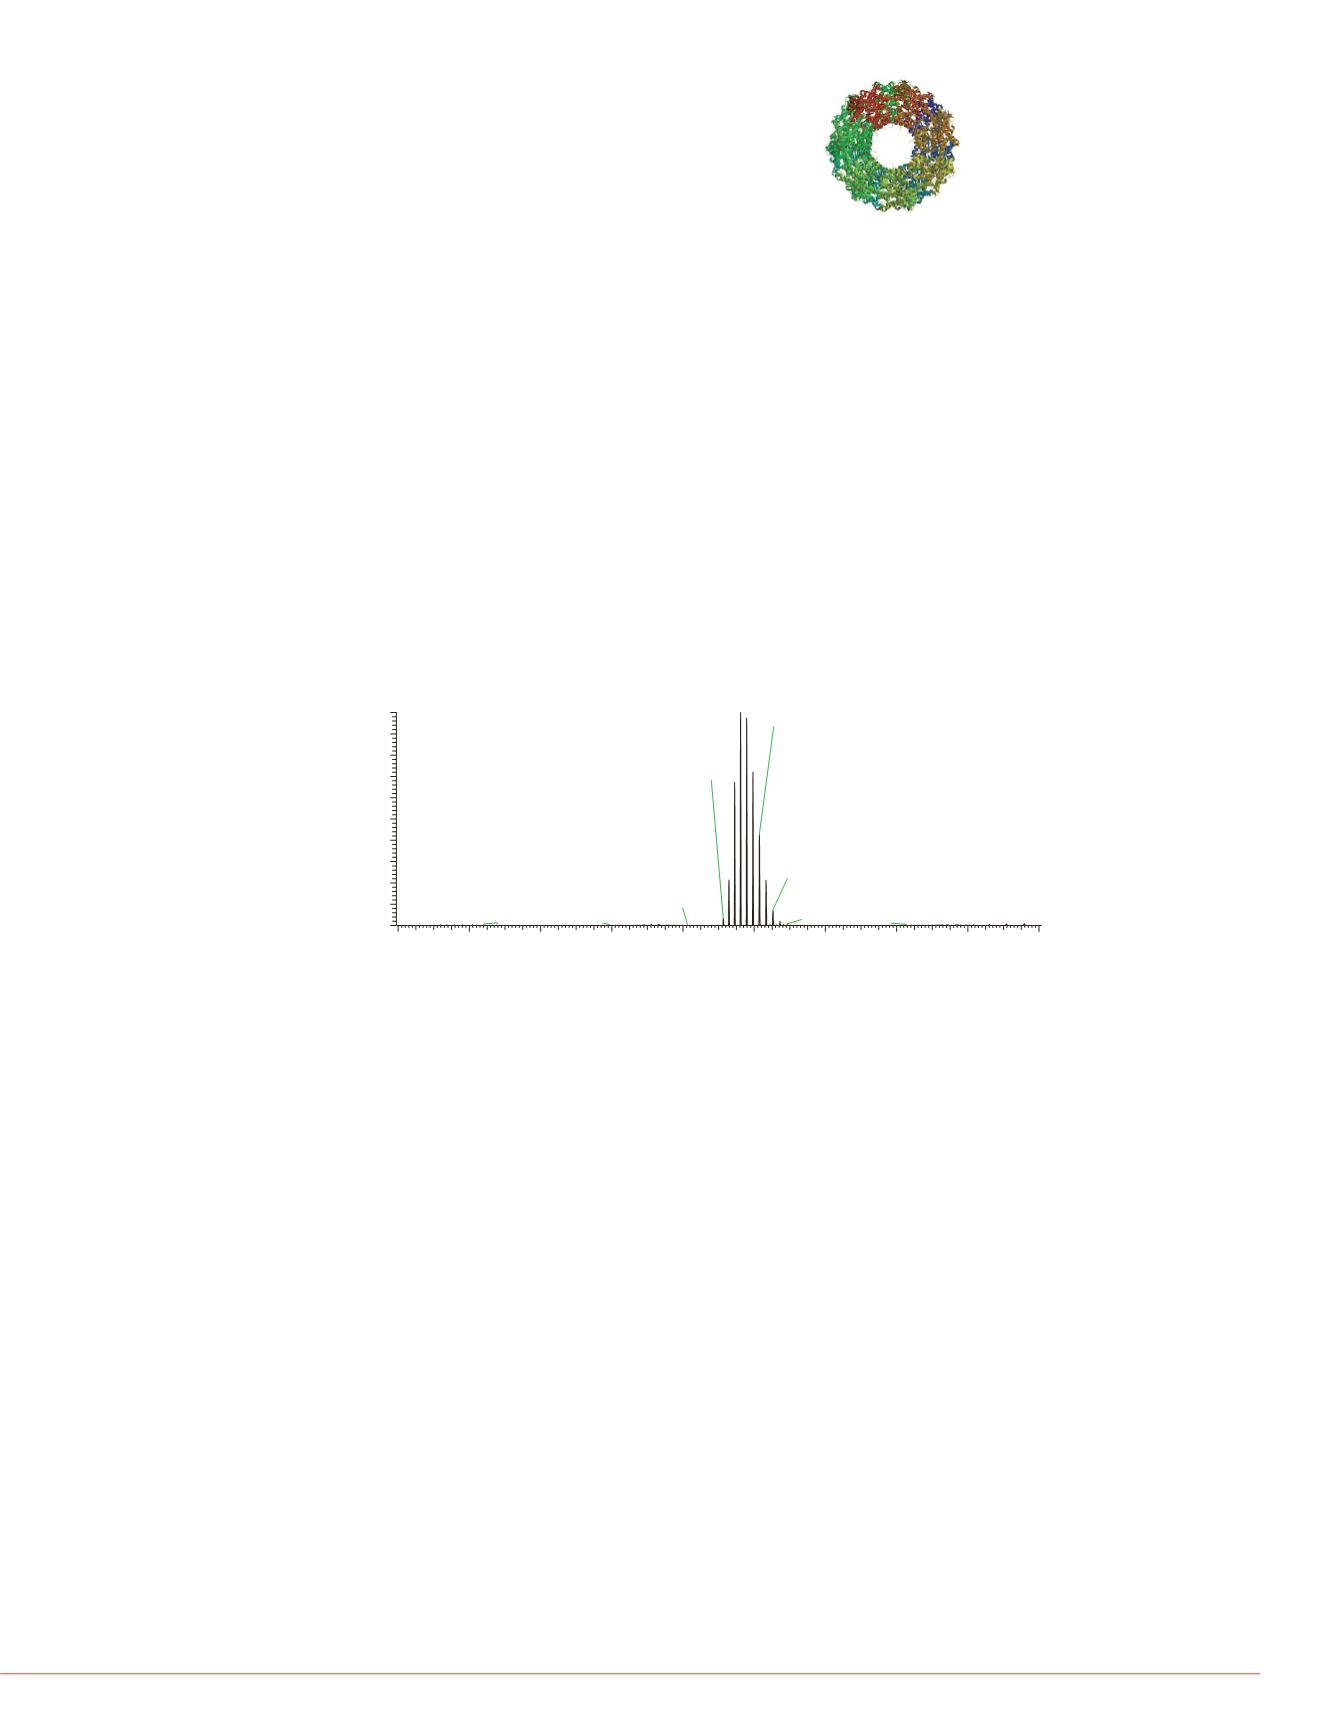
FIGURE 5. Spectrum of GroEL, showing the full
assembly of the 14-mer
Application of elevated fragmentation energy lead to
fragmentation of the assembly. The charge envelop of the
first fragment, the 13-mer became the dominant signal
reaching up to the upper mass range limint of
m/z
20000,
while the monomer signals were visible at the lower end of
the spectrum at the same time (see fig 6).


