4
Structure Characterization of Intact Monoclonal Antibody Using an Orbitrap Tribrid Mass Spectrometer
3000
3100
3200
3300
3400
4
913.66
2968.72
2971.95
3092.41
3032.59
3158.06
3154.66 3161.33 3226.77
3164.85
3295.13 3373.77
3000
3100
3200
3300
3400
0
3091.88
943.52
3158.17
2976.55
3389.29
3265.51
3000
3100
3200
3300
4
913.75
2971.90
3029.09
3092.13 3154.75 3223.57
3317.55
3000
3100
3200
3300
3400
13.75
2971.90
3029.09
3092.12 3154.75 3223.57
3317.55
cell pressure
including HCD cell pressure,
e heating temperature of the ESI
ment. 4 mTorr and 7 mTorr HCD
rgy of 60 and 100, MS full AGC
ed that these parameters had no
ent. However, it was found that
ction of the intact mAb. Figure 1b
apillary temperatures ranging from
100 ºC to 285 ºC, the charge
wer
m/z
with more than one order
to show signs of degradation at the
hat still maintained the intact mAb
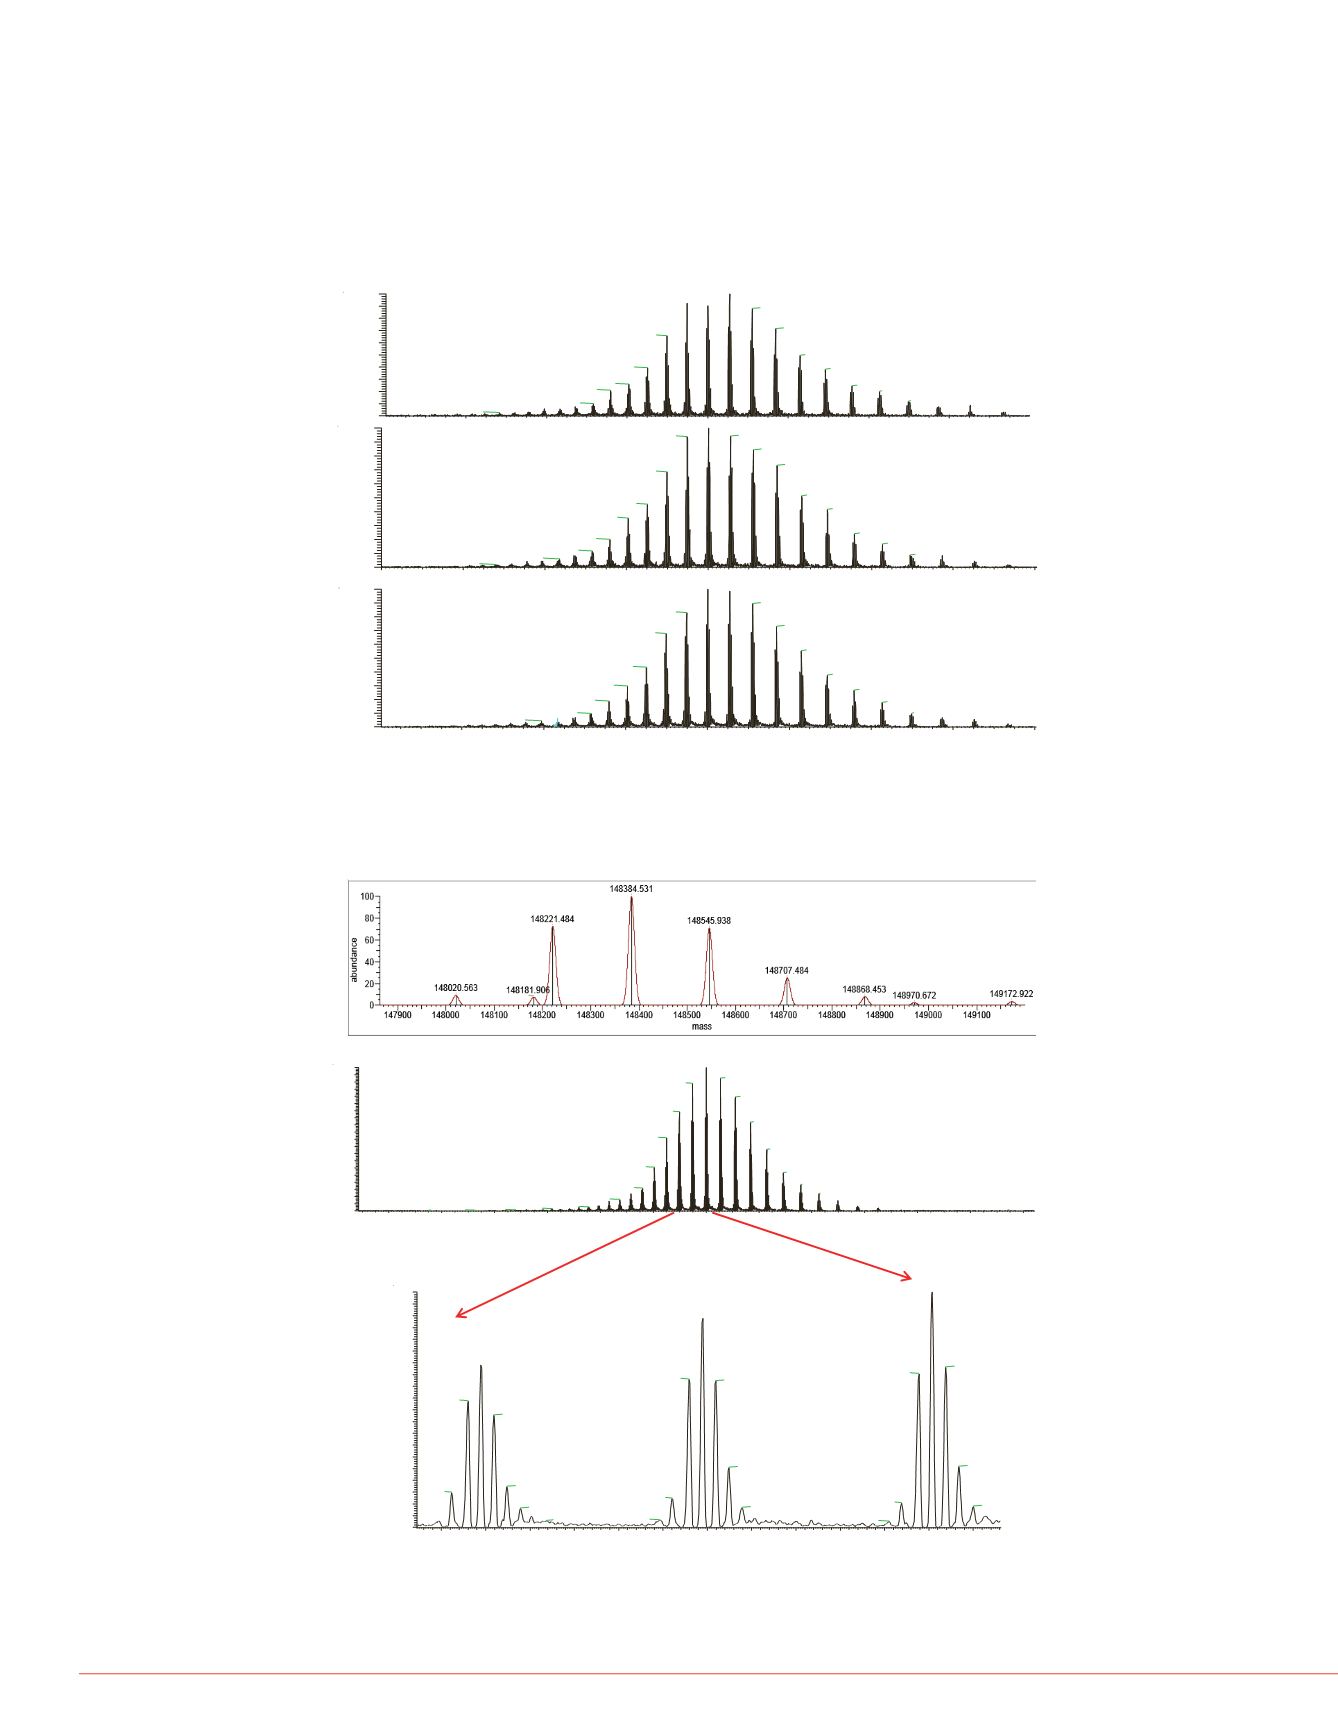
Using the optimized experiment parameters, 100 ng of mAb triplicate runs were used
to evaluate the reproducibility of the experiment. Figure 2 shows the results of this
reproducibility analysis, with the results looking highly similar between the three runs.
100 ng of mAb was then analyzed with the optimized experiment condition. The
molecular mass was measured with less than 15 ppm mass error for the analyzed
mAb. All five different glycoforms were also accurately identified. The results showed
in Figure 3.
FIGURE 2. Reproducibility of mAb analysis with Optimized experiment condition
ab_100ng_100sid_5e4_7mt_afterhmcali2
#
499-535
RT:
11.73-12.51
AV:
37
NL:
2.36E7
Isid=100.00 Fullms [1500.00-4000.00]
2000
2500
3000
3500
4000
m/z
2800.7167
z=?
2910.5257
z=?
2968.6759
z=?
2698.9524
z=?
3029.2735
z=?
3092.3402
z=?
2604.1698
z=?
3158.0747
z=?
3226.7675
z=?
2515.9933
z=?
3294.8918
z=?
2356.2757
z=1
3534.0317
z=?
2041.9296
z=?
3956.3528
z=?
.9689
?
8
9
10
11
12
13
14
15
16
17
Time (min)
11.77
11.86
11.96
12.03
12.16
12.29
12.38
12.51
12.90
11.60
13.44 14.35
7.43 7.84
10.11
8.39 9.61
15.16
17.78
16.01 16.90
NL:
9.11E7
BasePeak MS
073013_waterma
b_100ng_100sid
_5e4_7mt_afterh
mcali2
7mTorr
Denatured_DTT_reduced_waters_5
RT:
0.00 - 10.00
0.0
0.5
1.0
1.5
2.0
2.5
3.0
0
10
20
30
40
50
60
70
80
90
100
RelativeAbundance
0.16 0.34
1.08
0.86
1.22 1.56 1.75 2.03 2.12
2.97
2.61
600
700
800
900
1000 1100 1200
0
20
40
60
80
100
0
20
40
60
80
100
RelativeAbundance
897.1600
z=? 968.9456
z=?
835.4048
z=?
1100.8636
z=?
1
781.5663
z=2
734.2306
z=?
983.2181
z=?
1114.1092
z=?
908.7955
z=?
124
847.1902
z=?
796.0924
z=?
684.2031
z=?
Top-down ETD MS/MS
Top-down
Lig
073013_watermAb_100ng_100SID_5e4_7mT_AfterHMCali
#
434-506
RT:
10.28-11.94
AV:
73
NL:
8.39E6
T:
FTMS + p NSI sid=100.00 Full ms [1500.00-4000.00]
2200
2400
2600
2800
3000
3200
3400
m/z
0
10
20
30
40
50
60
70
80
90
100
RelativeAbundance
2854.5791
2748.8790
2910.5170
2968.7239
2698.9032
3029.3229
2650.8195
3092.4305
2604.3534
3158.1167
2559.1827
3226.7031
3298.4008
2516.0429
3451.8322
2394.3248
3533.8011
2282.9627
2122.4222
073013_watermab_100ng_100sid_5e4_7mt_afterhmcali2
#
494-516
RT:
11.62-12.09
AV:
23
NL:
3.15E7
T:
FTMS + p NSI sid=100. Full ms [150 .00-4000.00]
2000
2200
2400
2600
2800
3000
3200
3400
3600
m/z
0
10
20
30
40
50
60
70
80
90
100
RelativeAbundance
2800.7222
2748.8937 2854.5412
2910.5292
2968.6720
2698.9495
3029.2848
2650.7758
3092.3369
2604.1612
3158.0653
2559.3345
3226.7574
2515.9948
3294.8952
2436.1442
3451.9510
2280.6532
2116.1554
073013_watermab_100ng_100sid_5e4_7mt_afterhmcali3
#
489-529
RT:
11.62-12.49
AV:
41
NL:
2.12E7
T:
FTMS + p NSI sid=100.00 Full ms [1500.00-4000.00]
2200
2400
2600
2800
3000
3200
3400
3600
m/z
0
10
20
30
40
50
60
70
80
90
100
RelativeAbundance
2800.7530
2910.5491
2748.9063
2968.7034
2698.9251
3029.2853
2650.7236
3092.3923
2604.3405
3158.1221
2559.3597
3226.8235
2516.0477
3298.4156
3451.7799
2394.3595
2248.8929
Run 1
Run 2
Run 3
073013_watermAb_100SID_5e4
#
435-483
RT:
11.65-12.69
AV:
49
NL:
2.87E7
T:
FTMS+pNSIsid=100.00 Fullms [1500.00-4000.00]
1600
1800
2000
2200
2400
2600
2800
3000
3200
3400
3600
3800
4000
m/z
0
5
10
15
20
25
30
35
40
45
50
55
60
65
70
75
80
85
90
95
100
RelativeAbundance
2800.7177
z=?
2854.5539
z=?
2748.9297
z=?
2910.4870
z=?
2698.9654
z=?
2968.6795
z=?
2650.8027
z=?
3029.2457
z=?
2604.2813
z=?
3092.3571
z=?
3158.1075
z=?
2559.3491
z=?
3226.8306
z=?
2474.1815
z=?
3373.3410
z=?
2356.2779
z=?
2217.9866
z=?
3537.9001
z=?
2080.4507
z=?
3808.9230
z=?
3941.2739
z=?
1928.6060
z=?
1761.9384
z=?
1623.7610
z=?
073013_watermAb_100SID_5e4
#
430-489
RT:
11.54-12.82
AV:
60
NL:
2.36E7
T:
FTMS+pNSIsid=100.00 Fullms [1500.00-4000.00]
2690
2700
2710
2720
2730
2740
2750
2760
2770
2780
2790
2800
2810
m/z
0
5
10
15
20
25
30
35
40
45
50
55
60
65
70
75
80
85
90
95
100
RelativeAbundance
2800.7177
z=?
2748.9297
z=?
2698.9641
z=?
2803.8044
z=?
2797.7166
z=?
2745.9452
z=?
2751.8730
z=?
2695.9974
z=?
2701.8272
z=?
2806.7508
z=?
2754.8468
z=?
2704.7705
z=?
2692.2985
z=?
2742.0917
z=?
2793.8027
z=?
2810.0054
z=?
2757.7782
z=?
2707.8087
z=?
2773.4383
z=?
2739.3190
z=?
2713.6711
z=?
2790.9592
z=?
2723.5032
z=?
7 ppm
13 ppm
9 ppm
5 ppm
2 ppm
Top-down LC-MS/MS of mAb
To characterize the mAb seque
reduced mAb light and heavy c
workflow diagram for the analys
two separate LC-MS runs. The
were measured with low ppm m
time of 15 ms generated the mo
backbone sites fragmented. An
fragmentation with a fragmentat
and HCD data produced around
FIGURE 3. mAb mass measurement with optimized experiment conditions, 100ng
on PepSwift column.
G0F+G0F
G1F+G1F
G0F+G1F
G1F+G2F
G2F+G2F
of
nvelope
Deconvoluted spectrum of analyzed mAb
Figure 4 Top-down LC-MS/M
a) The online top-down MS/M
both ETD and HCD
FIGURE 5. Top-down LC-MS/
Sequence coverage from ETD
TIC


