6
Monoclonal Antibody and Related Product Characterization under Native Conditions using a Benchtop Exactive Plus EMR MS
Complexes
s recorded at a resolution of
hown in Figure 4A, when an
μM), three species are
Native MS Analysis of a Mixture of Eleven N-deglycosylated Humanized Antibodies
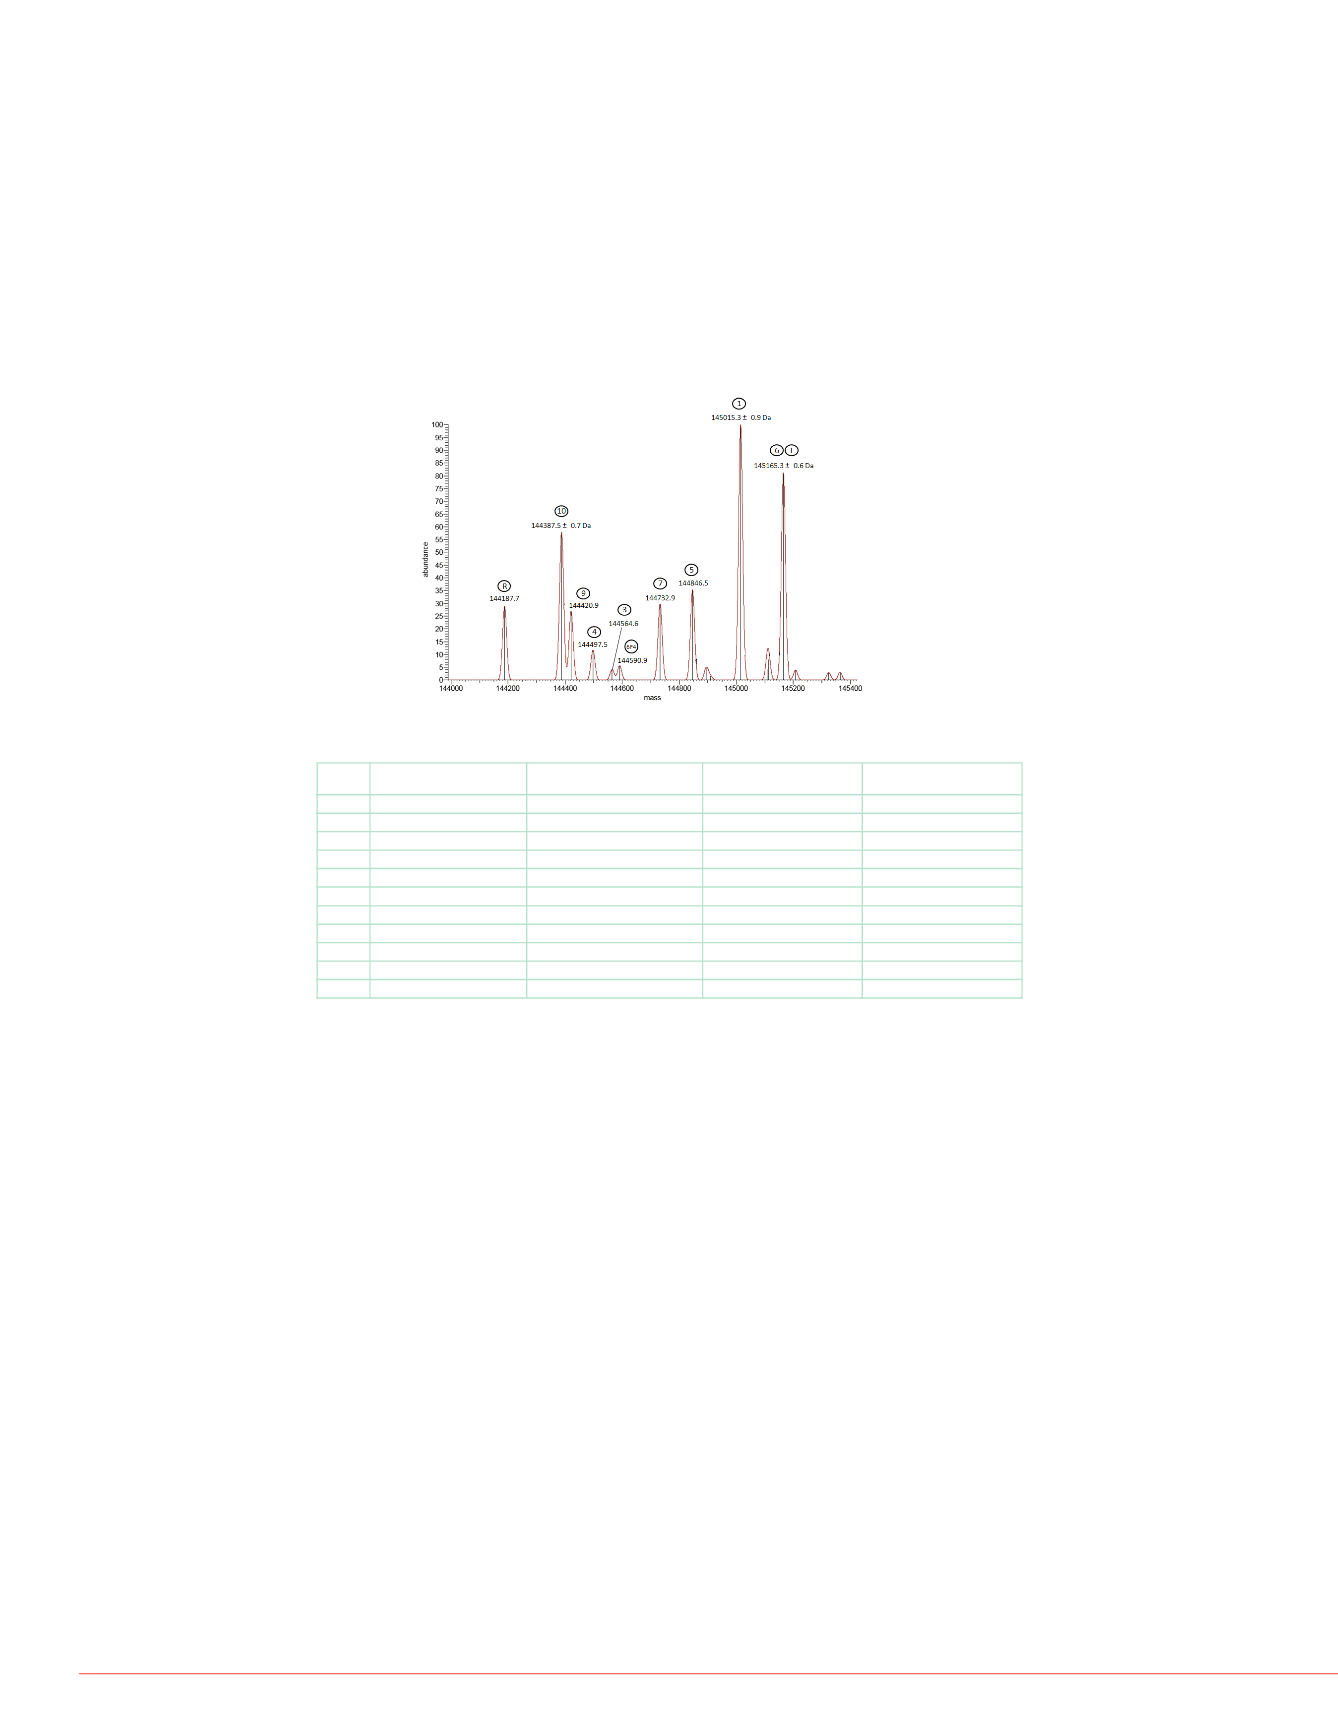
Figure 5 presents a deconvoluted mass spectrum of a mixture of eleven distinct
deglycosylated humanized IgG antibodies. The well-resolved ion signals at a detection
resolution of 140,000 and accurately measured masses enable the unambiguous assignment
ack), 1:1 (MW 174304.4 ±
AM-A complexes. Native MS
.4 mAb. MWs correspond to
e estimated from MS peak
nd 1:2 stoichiometries were
b
t 33% Fi
4B
of ten out of the eleven compounds. Trastuzumab and Hz6F4-2v6 could not be differentiated
due to very close molecular weights (2 Da). Peaks corresponding to Hz6F4-2 and Hz6F4-
2v3, which differ by only 21 Da in mass, are clearly distinguished on the mass spectrum.
However, they are not baseline resolved, and when combined with the low signal-to-noise
(S/N) ratio (S/N < 20), that causes a relatively low mass accuracy for Hz6F4-2. However, with
d i
l t
i
ti (S/N 50)
ith t b li
l d k f
l
represen s
. gure
harge state distribution in
a goo s gna - o-no se ra o
>
, even w ou ase ne-reso ve pea s, or examp e,
peaks of Hz6F4-2v9 and 6F4-2v10, the mass accuracies are achieved in the low ppm range
for both species (see Table 1).
Figure 5. Deconvoluted mass spectrum of the Native MS analysis of a mixture
of eleven N-deglycosylated humanized antibodies.
b/antigen complexes.
en binding stoichiometries.
TABLE 1 Measured and theoretical masses for the mixture of eleven N-
.
deglycosylated humanized antibodies at an Orbitrap detection resolution of 140k.
Species
Theoretical masses (Da) Measured masses (Da) Mass accuracy (ppm)
R
Rituximab
144186.3
144187.7
9.7
10
6F4-2 v10
144388.3
144387.5
5.5
9
6F4-2 v9
144420.5
144420.9
2.8
4
6F4-2 v 4
144498.4
144497.5
6.2
3
6F4-2 v3
144564.4
144564.6
1.4
6F4
6F4-2
144585.5
144590.9
37.3
7
6F4-2 v7
144732.5
144732.9
2.8
5
6F4-2 v5
144846 9
144846 5
2 8
Conclusion
.
.
.
1
6F4-2 v1
145015.3
145015.3
0
6
6F4-2 v6
145163.3
N.D
N.D
T
Trastuzumab
145165.5
145165.3
1.4
The Orbitrap mass analyzer can baseline resolve a native mAb’s glycan peaks, as well
as the interference peaks, ensuring excellent mass accuracy in the low ppm range.
The Exactive Plus EMR MS is able to sensitively characterize ADC complexes with
mass differences between peaks corresponding to different additional number of
payloads/drugs. For each set of peaks, the drug-to-antibody ratio (DAR) can be
determined as well as the relative ratio of each detected compound in order to assess
the mean DAR value.
Native Orbitrap MS can reveal the number of antigens bound to mAbs. Relative
abundances of mAb/Ag complexes at different stoichiometries can be achieved from
MS peak intensities.
The Exactive Plus EMR MS enables the high throughput screening of mAb mixtures,
ensuring excellent mass accuracy for each individual mAb.
R fe erences
1. Heck, A. J. Nat. Methods 2008, 5, 927-933.
2. Beck, A. et al., TrAC 2013, 48, 81-95.
3. Beck, A. et al., Anal. Chem. 2013, 85, 715-36.
4. Atmanene, C. et al., Anal Chem 2009, 81, 6364-73.
Herceptin is a trademark of Roche. Adcetris is a trademark of Seattle Genetics. NanoMate is a trademark of Advion
Biosystems. All other trademarks are the property of Thermo Fisher Scientific and its subsidiaries.This information
is not intended to encourage use of these products in any manners that might infringe the intellectual property rights
of others.
5. Debaene, F. et al., Anal Chem 2013, 85, 9785-92.
PO64091-EN 0614S


