5
Thermo Scientific Poster Note
•
PN-64136-ASMS-EN-0614S
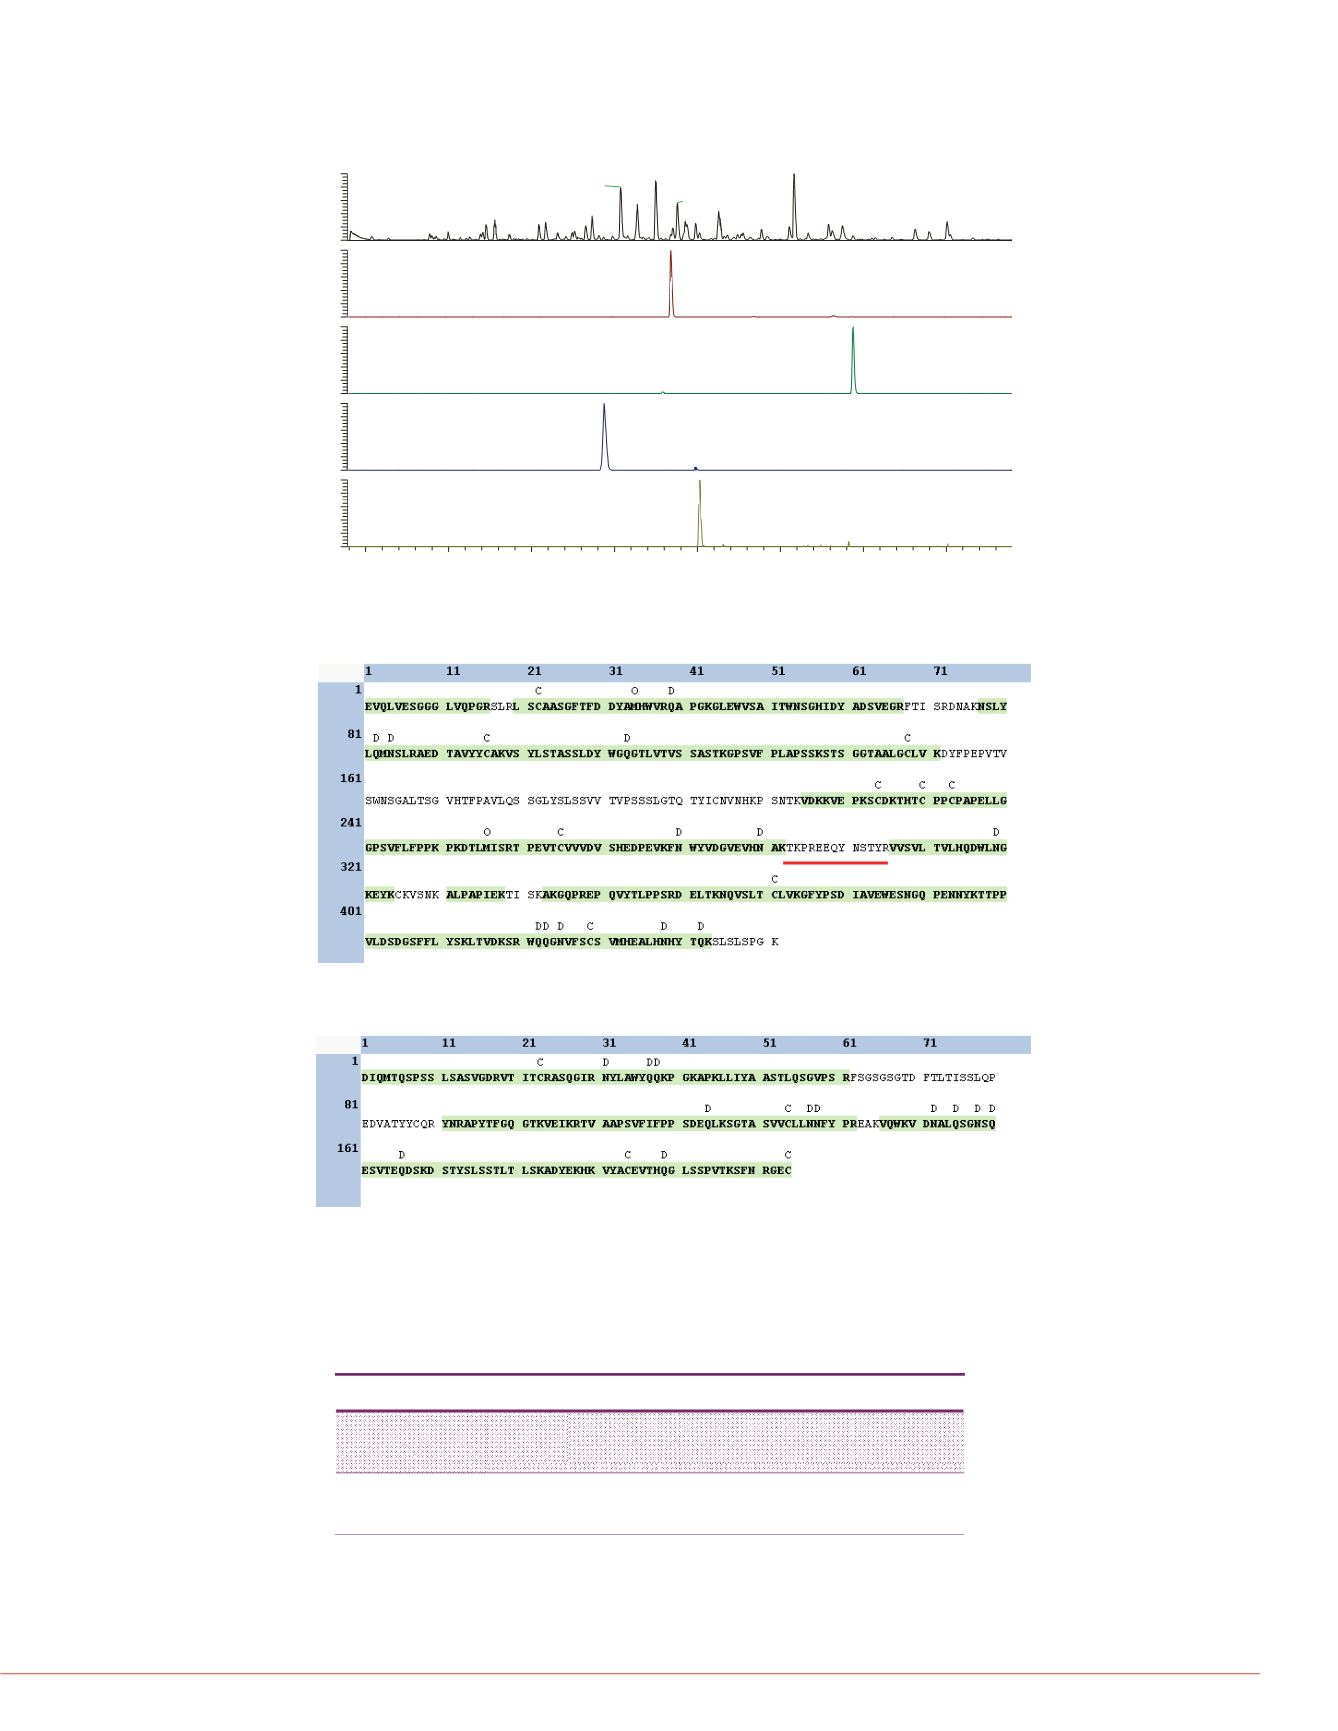
FIGURE 2. LC-MS chromatograms for 5 ng/mL adalimumab from plasma. A) Base peak
chromatogram. B-D) Extracted ion chromatrograms for three adalimumab peptides. E)
Extracted ion chromatogram for one PRTC standard peptide at 200 fmol.
100
682.7032
547.3176
NL: 1 06E8
FIGURE 5. Full MS trace showing
peptide TKPREEQYNSTYR at 5 ng
b
0 ng spiked into plasma at 1
uced to heavy chain (HC) and
60
80
100
0
20
40
60
80
575.3115
500.8056
581.3186
NQVSLTcLVK
,
+2
0 7
.
NL: 9.65E6
A
B
70
75
80
85
90
95
100
rum generated provided two
on is indicative of incomplete
mass at 23413.72 is within 1 Da
econvolution of the HC mass
tive of a modification by loss of the
Base peak chromatogram of
light chain (LC) and heavy chain
0
20
40
60
80
100
RelativeAbundance
0
20
40
599.9702
SGTASVVcLLNNFYPR
,
+3
0.7 ppm
. ppm
NL: 7.29E6
C
30
35
40
45
50
55
60
65
RelativeAbundance
972.0947
z=3
976.4959
z=1
Hex3HexNAc3
can. The mass at 50806.32
C
ctively. D) The deconvolved
rage mass (M+H) of HC.
80
100
0
20
40
60
80
100
578.5572
801.4118
PRTC peptide
GQPREPQVYTLPPSRDELTK
,
+4
1.2 ppm
NL: 1.34E6
NL: 7.07E5
D
E
950
100
0
5
10
15
20
25
918.0775
z=3
996.92
z=4
932.1917
z=4
1
Hex2HexNAc3dHex
8.66
NL: 8.77E7
5
10
15
20
25
30
35
40
Time (min)
0
20
40
60
0.04 ppm
FIGURE 3. Bottom-up sequence coverage for adalimumab HC at 5 ng/mL. Note the
S
He
FIGURE 6. Relative retention time
HC peptide TKPREEQYNSTYR.
sequence underlined in red was determined to be heavily glycosylated based on M
full scan data. C = carbamidomethylation, O = oxidation, D = deamidation.
ance
50
100
0
50
100
9.0
9.5
10.0
10.
in)
50
100
0
50
100
Relative Abund
0
1447.9270
1236.2184
1535.6830
6 3682
1583 5670
100
0
50
100
0
.
.
1689.2232
1809.6181
FIGURE 4. Bottom-up sequence coverage for adalimumab LC at 5 ng/mL.
C = carbamidomethylation, O = oxidation, D =
deamidation
.
7.0
7.5
0
50
1200
1400
1600
1800
m/z
Conclusion
The data demonstrates the
reproducible and robust me
The analytical detection limi
human plasma samples wa
MSIA Streptavidin Workflo
i F t
ti
t
Note that we did not expect to detect the heavy chain tryptic peptide D
152
-K
214
nor the
light chain tryptic peptide F
62
-R
90
due to their extreme hydrophobicities and thus
gener c c arge ng cap ur
affinity ligand.
The described method prov
adalimumab model, multipl
foundation for other high va
TABLE 1. Bottom-up analysis of adalimumab peptides: Coverage for adalimumab
from varying concentrations. Note that replicates were not performed.
incompatibilities with C18 chromatography. Therefore, with trypsinization only 81% of
the heavy chain and 85% of the light chain sequences are LC-MS/MS exceptional.
Ratio determination of Antib
The MSIA Streptavidin Wor
therapeutic neutralization e
The described method sets
ng/mL, 10 ng/mL, 50 ng/mL,
ved from matrix by using TNF-
5 ng/mL 10 ng/mL 50 ng/mL 500 ng/mL 5000 ng/mL
HC % Sequence
Coverage
79% 73% 63% 67% 78%
simultaneous determination
therapeutic molecule.
the purified analyte was subject
the LC-MS/MS sequence
LC % Sequence
Coverage
85% 75% 73% 77% 75%
*
The percentage sequence coverages are based on the full heavy chain and light chain sequences.
SEQUEST is a registered trademark of the
Fisher Scientific and its subsidiaries. This inf
manners that might infringe the intellectual p


