6
Analysis of Monoclonal Antibodies, Aggregates, and Their Fragments by Size Exclusion Chromatography Coupled with an Orbitrap Mass Spectrometer
Conclusions
mAb monomer and dimer aggregate intact mass can be measured by SEC-
MS under non-denaturing condition using near neutral pH eluent, such as 20
mM ammonium formate.
The Exactive Plus EMR mass spectrometer enables the accurate detection
of mAb at
m/z
350- 20,000.
mAbPac SEC-1 column successfully separates the HC and LC, and partially
separates Fab, and Fc fragments using denaturing eluent such as 20%
acetonitrile, 0.1% formic acid, and 0.05% trifluoroacetic acid.
References
1.
Lin, S., Rao, S., Thayer, J., Agroskin, Y., and Pohl, C., Automated
Monoclonal Antibody 2-Dimensional Workflow: from Harvest Cell Culture to
Variant Analysis. Presented at The WCBP Conference, San Francisco, CA,
January 23
–
25, 2012.
2.
Valliere-Douglass J. F., McFee W., A., and Salas-Solano O., Native Intact
Mass Determination of Antibodies Conjugated with Monomethyl Auristatin E
and F at Interchain Cysteine Residues. Anal. Chem. 2012, 84, 2843-2849.
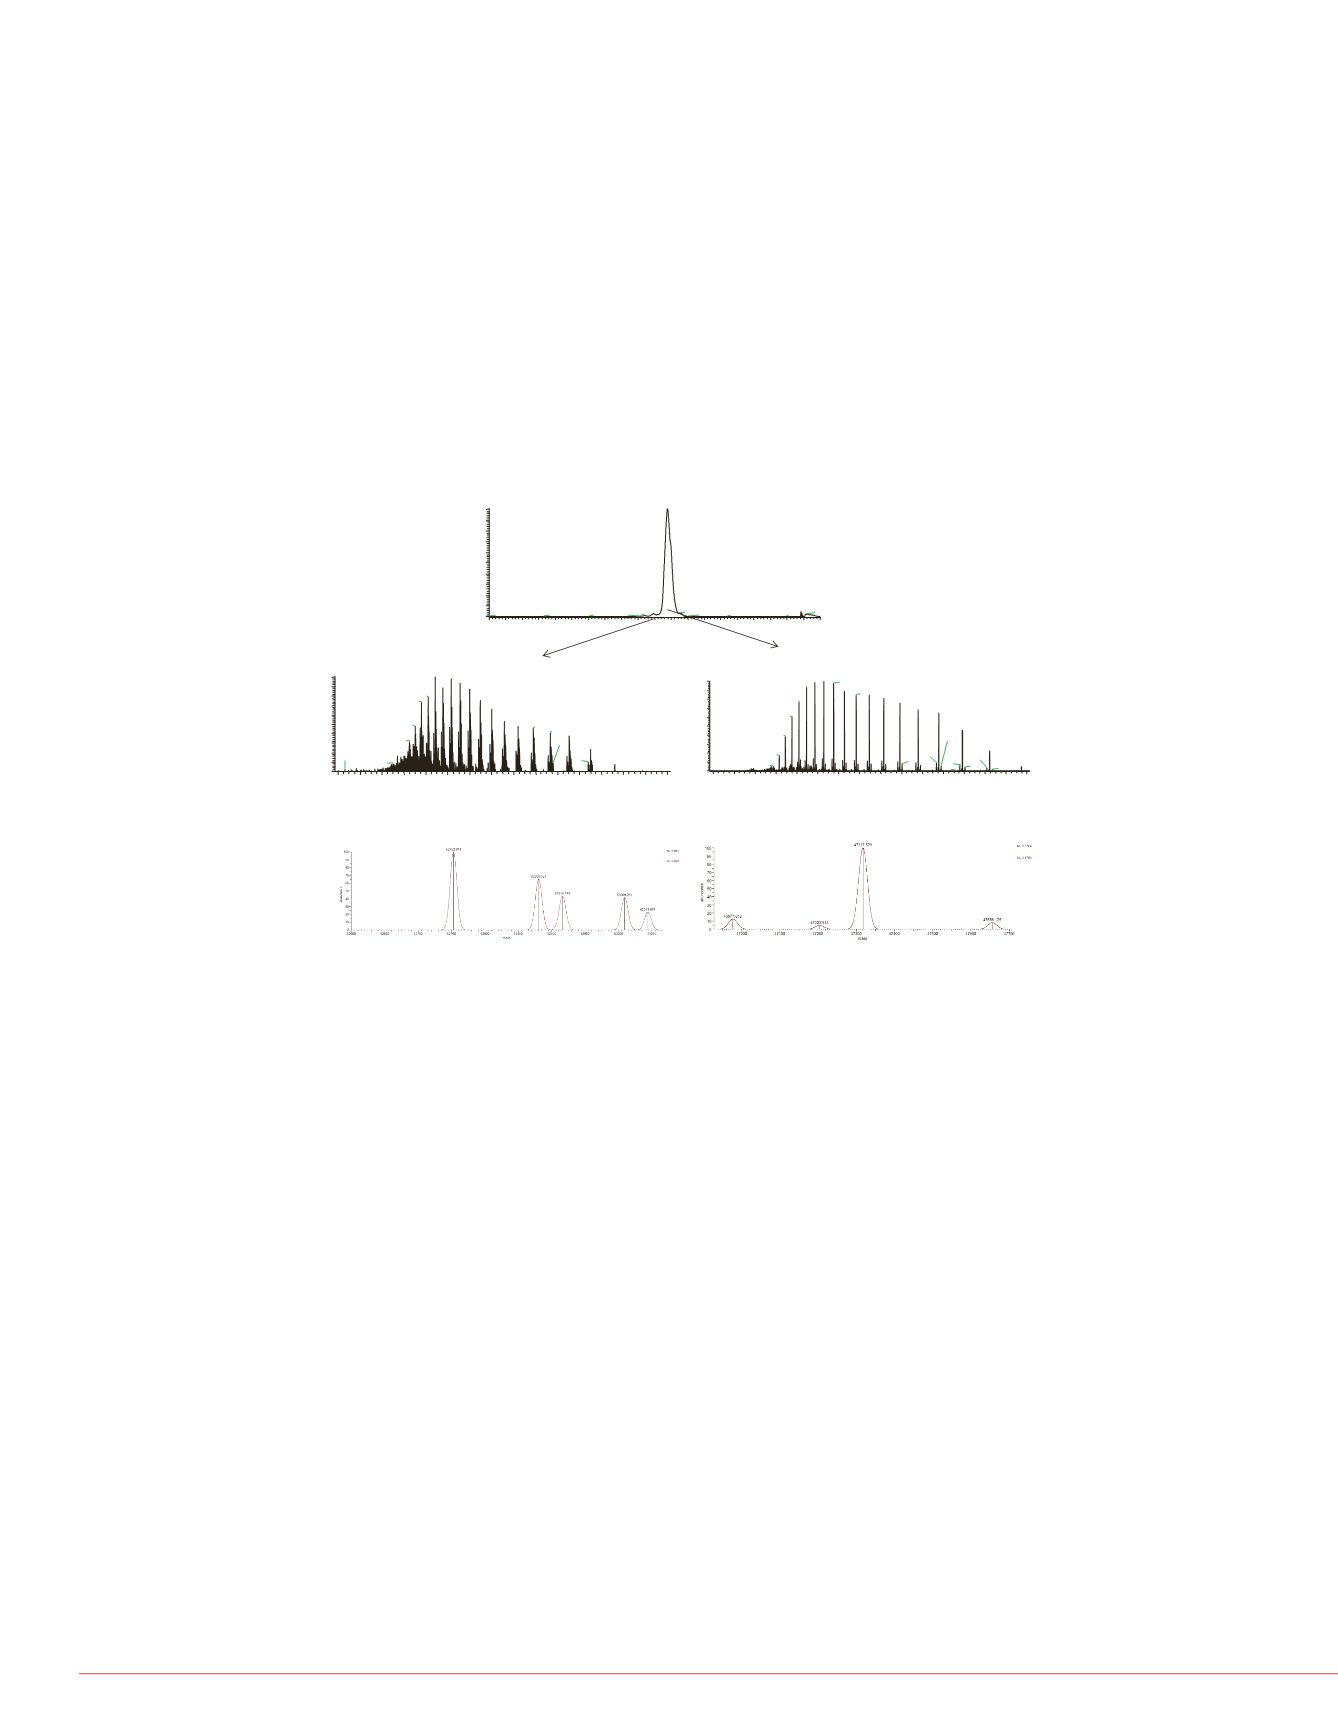
FIGURE 4: SEC-MS analysis of mAb1 Fc and Fab under denaturing condition
using 20% acetonitrile, 0.1% formic acid and 0.05% trifluoroacetic acid
. mAb was
injected onto a MAbPac SEC-1 4 x 300 mm column and the flow rate was set at 200
µL/min.
(a) extracted ion chromatogram of Fc and Fab, (b) mass spectrum of Fc, (c)
deconvoluted spectrum of Fc, (d) mass spectrum of Fab, (e) deconvoluted spectrum
of Fab.
odifications, such as
oglutamation, methionine
of the mAbs and sequencing of
suming. A simpler and faster
tions is to measure the mass of
eavy chain and light chain are
nts are generated by papain
d in the Fc region of the heavy
n and Fc fragment mass
s should only show a single
Ab1 using 20% acetonitrile,
extracted ion chromatogram of
0.78-2601.88. Using this
min and mAb LC elutes at
their HC and LC have similar
as a platform method for the
charge envelope of mAb HC in
convoluted mass spectra of the
ent peaks at mass 50,742.3 u,
different glycoform with 1
-terminal of the HC. Figure 3d
of 1500-3500 and Figure 3e
ith a single peak at mass
does not have C-terminal lysine
148,029 u using the equation
nt with the measured mass at
Sigma is a registered trademark of Sigma-Aldrich Co. LLC. All other trademarks are the property of Thermo Fisher
Scientific and its subsidiaries.
This information is not intended to encourage use of these products in any manners that might infringe the
intellectual property rights of others.
PO64082-EN 0614S
d light chain under
rmic acid and 0.05%
SEC-1 4 x 300 mm column
chromatogram of heavy
avy chain (HC), (c)
pectrum of light chain (LC),
Using the same chromatographic method, Fc and Fab fragments from mAb1 are eluted
off the SEC column at 9.94 and 10.79 min (Figure 4a), although the separation is not as
good as the HC and LC due to the fact that Fab and Fc fragments are very similar in
size. Figure 4b shows the charge envelope of Fc in the
m/z
range of 1500-3500 and
Figure 4c shows the deconvoluted mass spectra of the Fc, with a main peak at mass
52,752.9 u and adjacent peaks at mass 52,880.5 u, and 52,916.1 u, corresponding to a
lysine variant and a different glycoform with 1 additional hexose. Figure 4d shows the
charge envelope of Fab in the
m/z
range of 1600-3700 and Figure 4e shows the
deconvoluted mass spectra of the Fab, with a single peak at mass 47317.6 u. The intact
mass of mAb is determined at mass 147,387 u using the equation 2xFab+Fc. The
calculated mass is more than 700 u away from the measured mass at mass148,035 u,
indicating an additional fragment generated from the papain digestion.
14.5 15.0 15.5 16.0 16.5
4.31 15.03
1600
1800
2000
2200
2400
2600
2800
3000
3200
3400
3600
3800
4000
m/z
2601.34
2341.31
2926.39
2128.55
1951.24
1801.26
1672.69
3344.41
1561.09
2619.36
2946.82
3901.71
3121.58
3601.60
2385.90
6
2169.16
1988.65
3367.77
2754.36
Full MS of light chain (LC)
+10
+9
+8
+11
+12
+7
+13
0
1
2
3
4
5
6
7
8
9
10
11
12
13
14
15
16
17
18
19
20
Time (min)
0
10
20
30
40
50
60
70
80
90
100
RelativeAbundance
10.79
18.85
11.52
9.94
19.17
9.43
9.03
12.07 13.76 14.39
0.04
7.58
5.63 6.04
1.21 2.09 2.97 3.34 4.55
18.07
1000
1200
1400
1600
1800
2000
2200
2400
2600
2800
3000
3200
3400
3600
3800
4000
m/z
0
10
20
30
40
50
60
70
80
90
100
RelativeAbundance
2058.28 2151.77
1893.74
2254.19
2366.84 2629.71
1820.96
2784.33
2958.28
3155.45
1753.57
3380.77
1691.01
3640.78
1632.76
3132.79
2804.22
3356.47
3178.00
3944.06
1578.28
3404.94
3614.62
1388.13
3666.77
1226.59
3314.32
1049.51
1000
1200
1400
1600
1800
2000
2200
2400
2600
2800
3000
3200
3400
3600
3800
4000
m/z
0
10
20
30
40
50
60
70
80
90
100
RelativeAbundance
1885.02 2029.96
2198.99
1820.08
2294.58
1759.45
2398.80
2513.00
1702.73
2638.61 2777.40
2931.65
3104.04
1649.52
3297.96
1541.93
3276.04
2958.26
1501.57
3517.84
1167.42
1064.47
3769.44
Full MS of Fc
Full MS of Fab
(a)
(b)
(c)
(d)
(e)
G0
G1
G0+Lys
G1+Lys
G0+2Lys
+20 +18
+16
+14
+12
+20
+18
+16


