4
Orbitrap Native MS Analysis of a Monoclonal
Antibody-Drug-Conjugate (ADC) Brentuximab
Vedotin
Antibody-drug conjugates (ADCs) are an increasingly
important modality for treating several types of cancer.
The impact of ADCs in this field is due to the exquisite
specificity of antibodies that deliver the conjugated
cytotoxic agent to targeted tumor cells preferentially, thus
reducing the systemic toxicity associated with traditional
chemotherapeutic treatments. ADCs are differentiable on
the basis of the drug, linker, and also the amino acid
residue of attachment on the antibody. Recently, two ADCs
were approved by the FDA (Adcetris
®
, brentuximab
vedotin, and Kadcyla
®
, trastuzumab emtansine) and
35 more are being investigated in clinical trials.
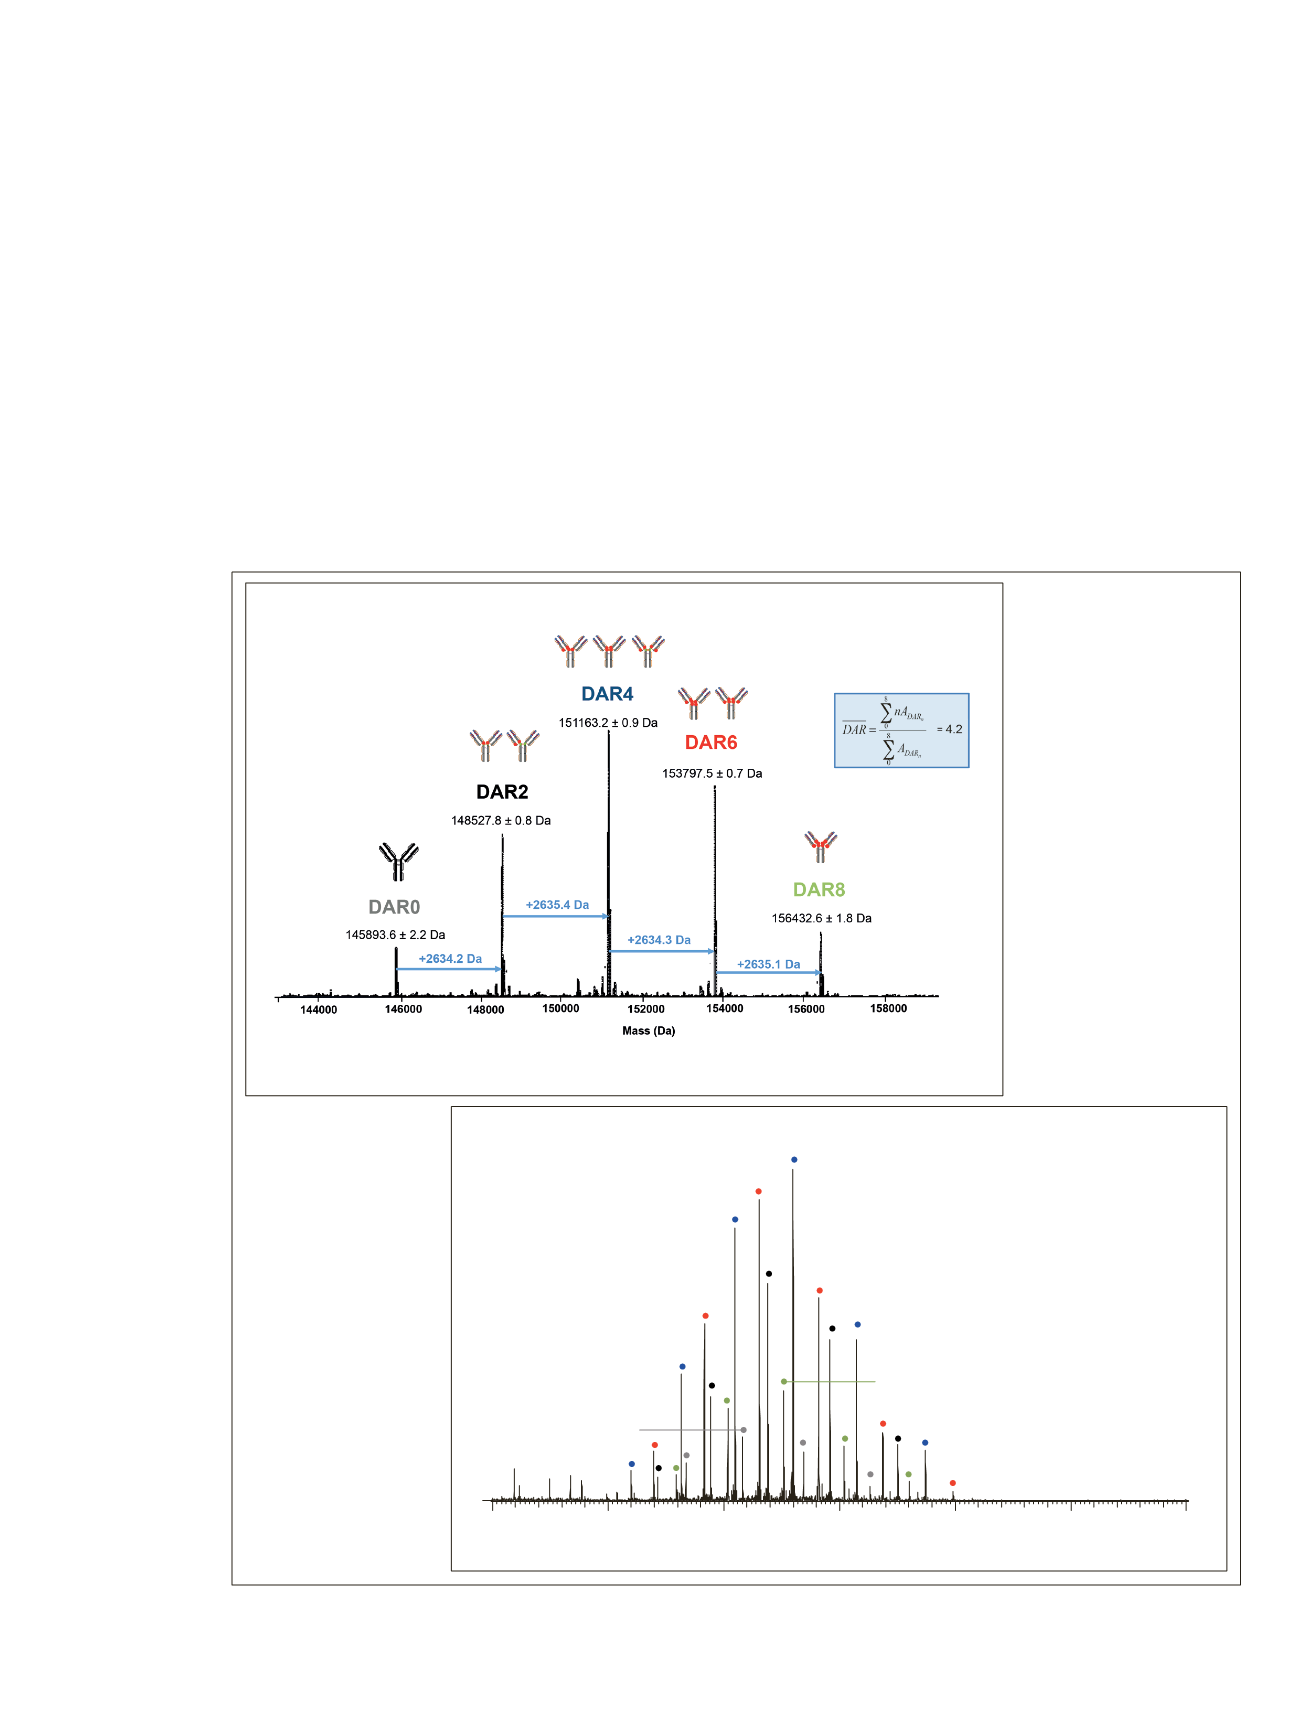
The brentuximab vedotin mass spectrum was recorded at a
resolution of 35,000 and in-source CID voltage was set to
75 eV. Figure 3A shows the native deconvoluted mass
spectrum of the deglycosylated ADC. Populations with zero
(grey), two (black), four (blue), six (red), and eight (green)
molecules loaded onto the antibody (payloads) were detected
with a mass difference between peaks corresponding to the
addition of two payloads (+2,634 Da). The drug loading
clearly increases in steps of two, which corresponds to
binding of one payload to the two accessible cysteine amino
acids after disulfide bridge reduction. For each set of peaks,
the drug-to-antibody ratio (DAR) can be determined. Relative
ratios of each detected compound were determined using MS
peak intensities and served to estimate the mean DAR (4.2),
which is in agreement with hydrophobic chromatography
data (data not shown). Figure 3B shows the corresponding
raw mass spectrum with the entire charge state distribution
of brentuximab vedotin under native conditions.
Figure 3. Orbitrap Native MS analysis of a monoclonal Antibody-Drug-Conjugate (ADC). A. Native deconvoluted mass spectrum
showing the determination of drug-to-antibody ratio (DAR). B. Raw mass spectrum with the entire charge state distribution of ADC
under native conditions.
A
m/z
5000
5500
6000
6500
7000
7500
8000
DAR4
24+
DAR6
25+
DAR8
25+
DAR2
24+
DAR0
24+
B


