9
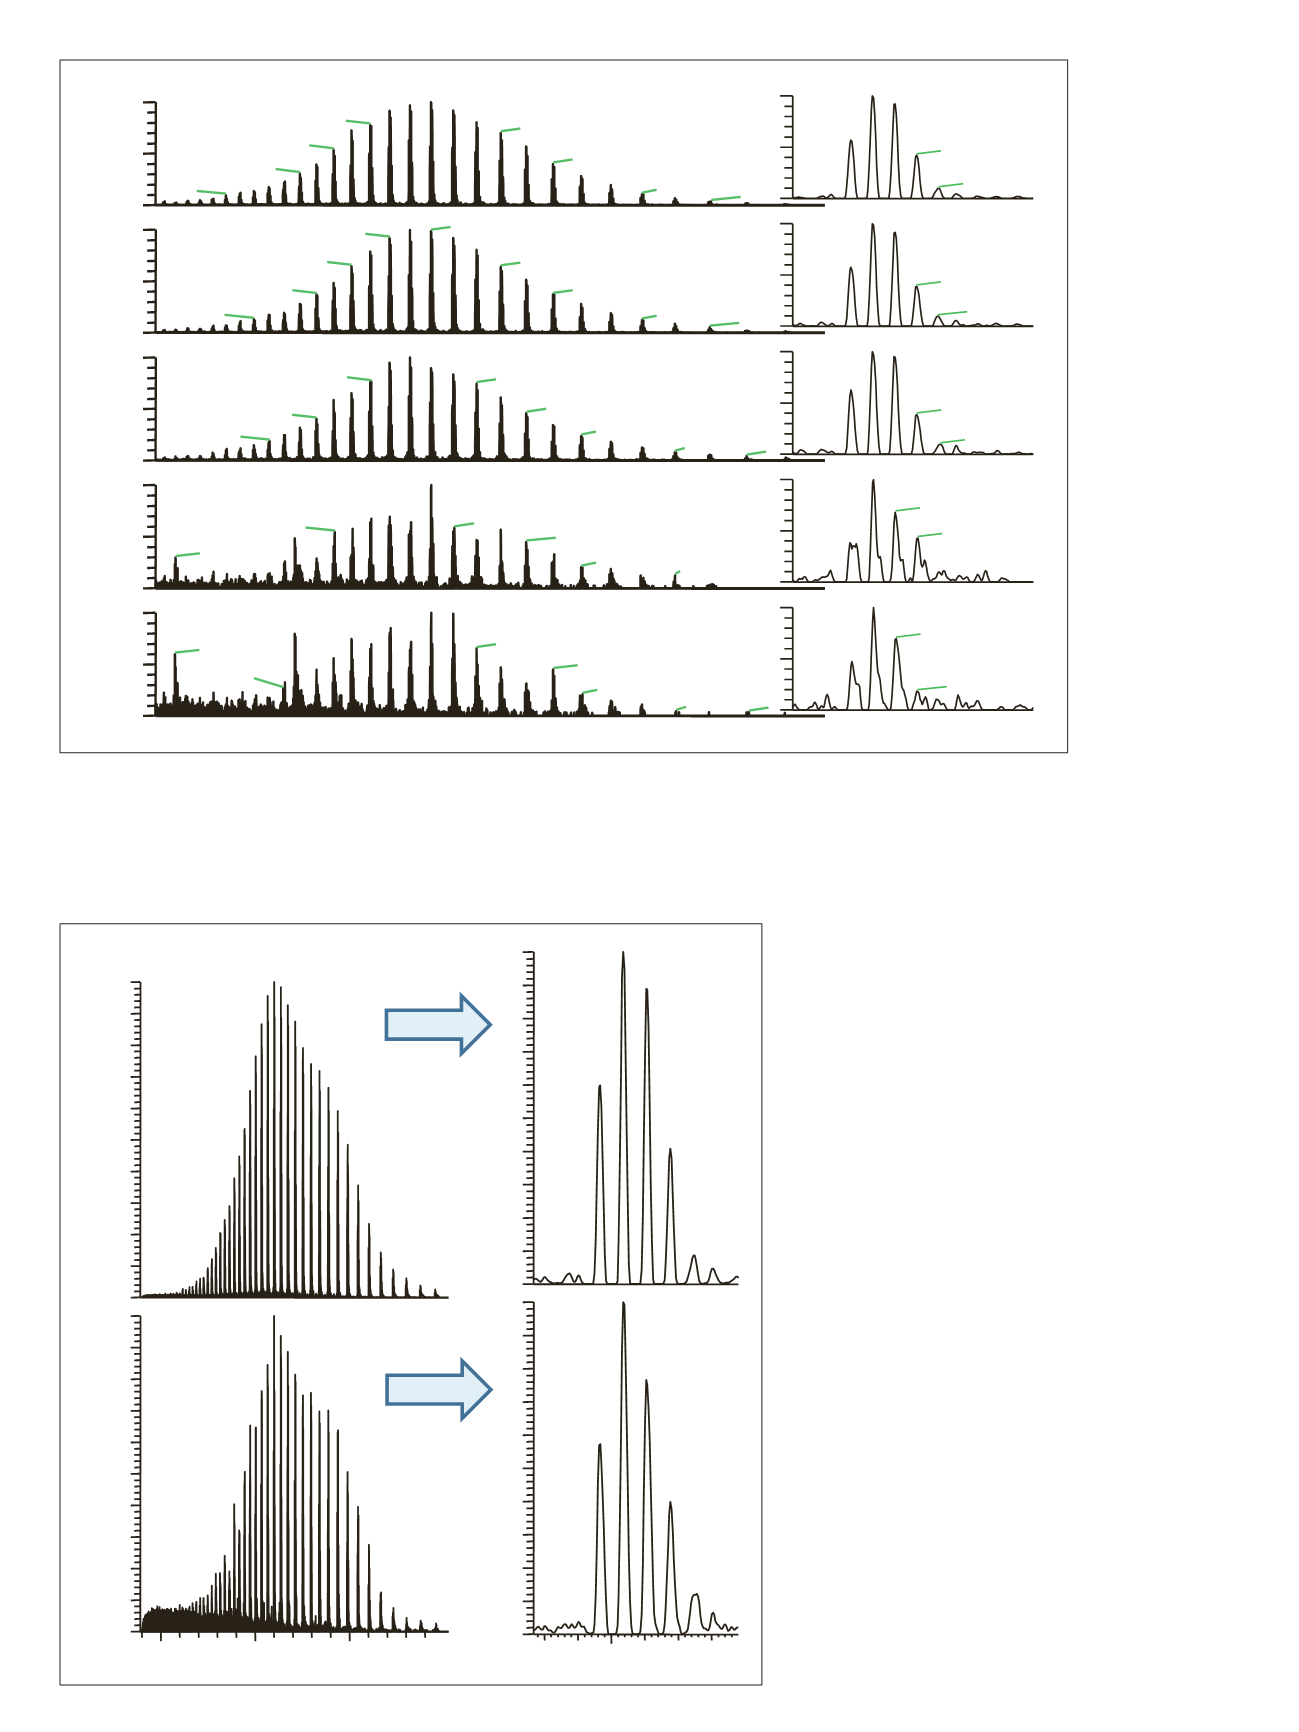
On the 50 mm x 1 mm i.d. monolithic ProSwift column,
30 ng and 150 ng of intact antibody were applied, both of
which produced high quality spectra (Figure 9). Based on
the 30 ng load it can be estimated that the lowest amount
still yielding a sufficient spectrum quality to be between
5 and 10 ng.
0
50
100
0
50
100
0
50
100
0
50
100
0
50
100
3272.94
3280.13
3283.75
3272.95
3280.11
3283.61
3272.94
3280.14
3284.03
3273.00
3276.65
3280.29
3291.49
3273.06
3276.72
3280.25
3275.62
20 ng
10 ng
5 ng
1 ng
500 pg
0
50
100
0
50
100
Relative Abundance
0
50
100
0
50
100
0
50
100
3272.94
3068.43
3506.66
2945.76
3681.95
2832.52
3980.46
2584.24
4212.43
3272.95
3133.71
3005.84
3506.64
3681.92
2888.06
2678.09
3980.44
4207.82
3201.85
3071.84
3425.13
3592.17
2888.01
3776.34
2730.65
4091.07
4331.69
3273.00
3133.89
3351.03
2949.06
3592.17
2414.86
3776.38
4091.22
3273.06
2815.40
3425.28
2413.08
3682.10
2776.75
3780.70
4095.23
4339.08
2967.21
3200
m/z
0
10
20
30
40
50
60
70
80
90
100
0
10
20
30
40
50
60
70
80
90
100
Relative Abundance
3201.80
3205.31
3198.28
3208.84
3212.38
3201.80
3205.31
3198.28
3208.84
3212.38
2000
3000
4000
5000
m/z
0
10
20
30
40
50
60
70
80
90
100
0
10
20
30
40
50
60
70
80
90
100
Relative Abundance
4750.60
4607.37
zoom
zoom
150 ng
30 ng
Figure 8. Full MS spectra from a dilution series of 20 ng to 500 pg of intact antibody, applied on a 250 mm x 0.2 mm i.d. monolithic
PepSwift column
Figure 9. Full MS spectra (left) and zoomed in view of the
highest abundant charge state (right) of 150 ng and 30 ng
loads of intact rituximab applied on a 50 mm x 1 mm i.d.
monolithic ProSwift column


