11
For the heavy chain, the peptide GQPR was also identified
based on the accurate mass of the intact peptide. Lastly, the
peptide containing the glycosylation site at position Asn
301
was not identified in its unglycosylated form based on an
MS/MS spectrum. A database search including the expected
glycans as modifications was successful. In addition, the
glycopeptides can easily be detected in the full scan spectra in
different glycosylated forms and in different charge states,
and the MS/MS spectra can easily be spotted due to the
presence of a characteristic peak pattern. The G0F-
containing peptide is shown as an example in Figure 13,
representing the intact precursor and the typical
fragmentation pattern obtained from glycopeptides using
HCD-type fragmentation: the two hexonium ions at mass
204 (HexNAc) and 366 (Hex-HexNAc) as well as the
fragment ions nicely showing the sequence ladder of released
hexose (
m/z
162), N-acetylhexosamine (203), and Fucose
(146). Considering all peptides on the MS full scan level and
based on MS/MS spectra via database searches, the sequence
coverage of the heavy chain is 99.5%, leaving only two
amino acids not covered (aa 343-344).
18
20
22
24
26
28
30
32
34
36
Time (min)
0
10
20
30
40
50
60
70
80
90
100
Relative Abundance
20.74 min
661.34 (+2)
138-151
HC
19.88 min
660.35 (+1)
444-450
HC
17.38 min
560.31 (+1)
145-148
LC
23.10 min
581.32 (+2)
365-374
HC
23.95 min
751.88 (+2)
169-182
LC
28.17 min
937.94 (+2)
397-413
HC
29.52 min
899.45
aa126-141
LC
32.51
1390.97 (+4)
Trypsin autolysis product
aa 50-99
22.8 min
421.25 (+2)
Trypsin autolysis product
aa 50-99
33.5 min
1680.08 (+4)
aa 152-214
HC
30.02 min
904.51 (+2)
aa 306-321
HC
27.9 min
1092.52 (+2)
aa 44-63
HC
25.35 min
934.42 (+2)
aa 421-443
HC
27.4 min
1273.07 (+2)
375-396
HC
26.16 min
896.41 (+2)
24-38
HC
24.36 min
539.83 (+2)
aa 126-137
HC
22.17 min
661.34 (+2)
aa 138-151
HC
21.29 min
938.96 (+2)
190-206
LC
19.04 min
523.28 (+2)
98-107
Trypsin
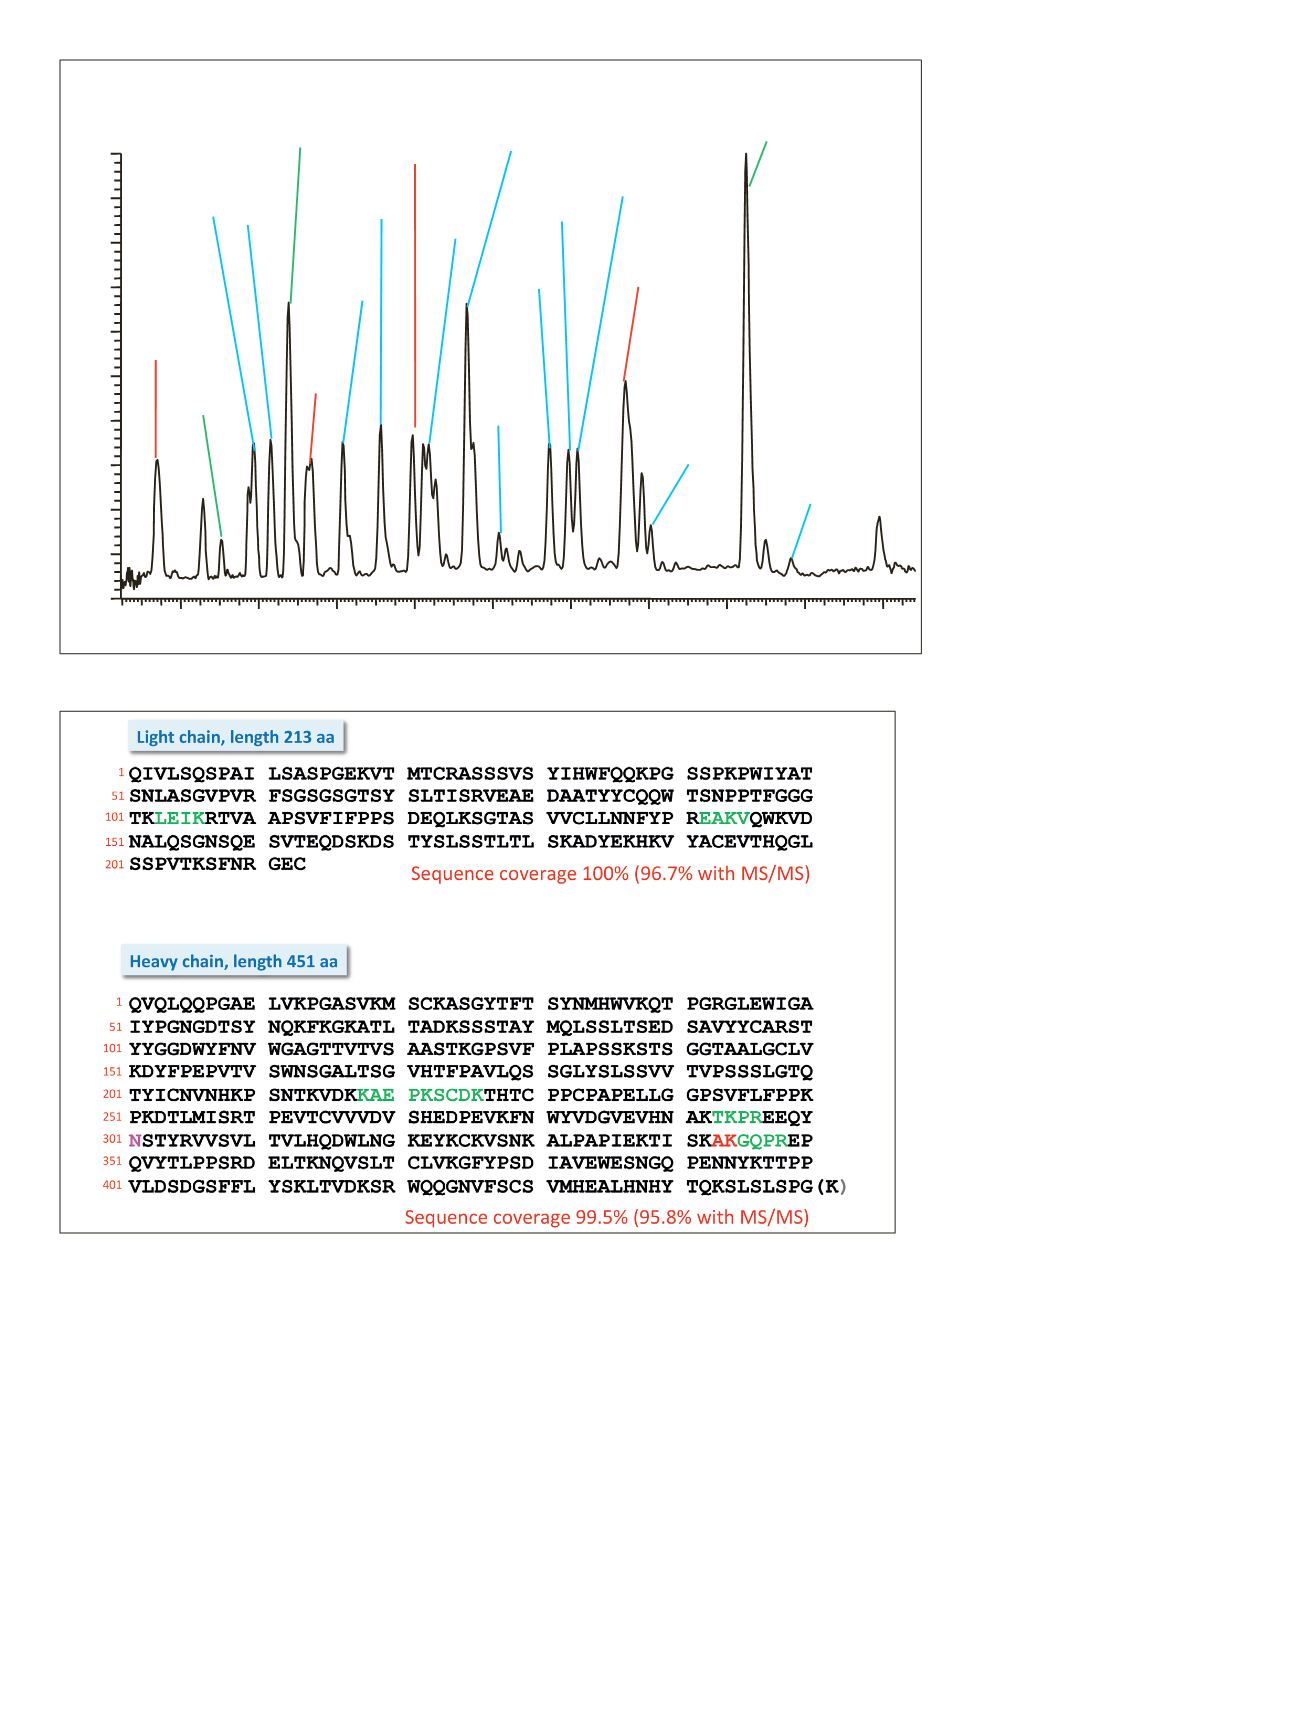
Figure 11. Base peak chromatogram of a digest using trypsin on the reduced and alkylated antibody rituximab
Figure 12. Amino sequence of light and heavy chains from rituximab. Amino acids shown in black letters represent
the parts identified based on MS/MS spectra. Sequences confirmed based on MS full scan data as intact peptides
only are shown in green. The two amino acids shown in red (AK) as part of the heavy chain could neither be covered
on the MS nor on the MS/MS level. Resulting sequence coverage for the light chain is 100% (96%with MS/MS) and
99.5% (98.8%with MS/MS) for the heavy chain. Asparagin
251
in the heavy chain represents the glycosylation site.


