3
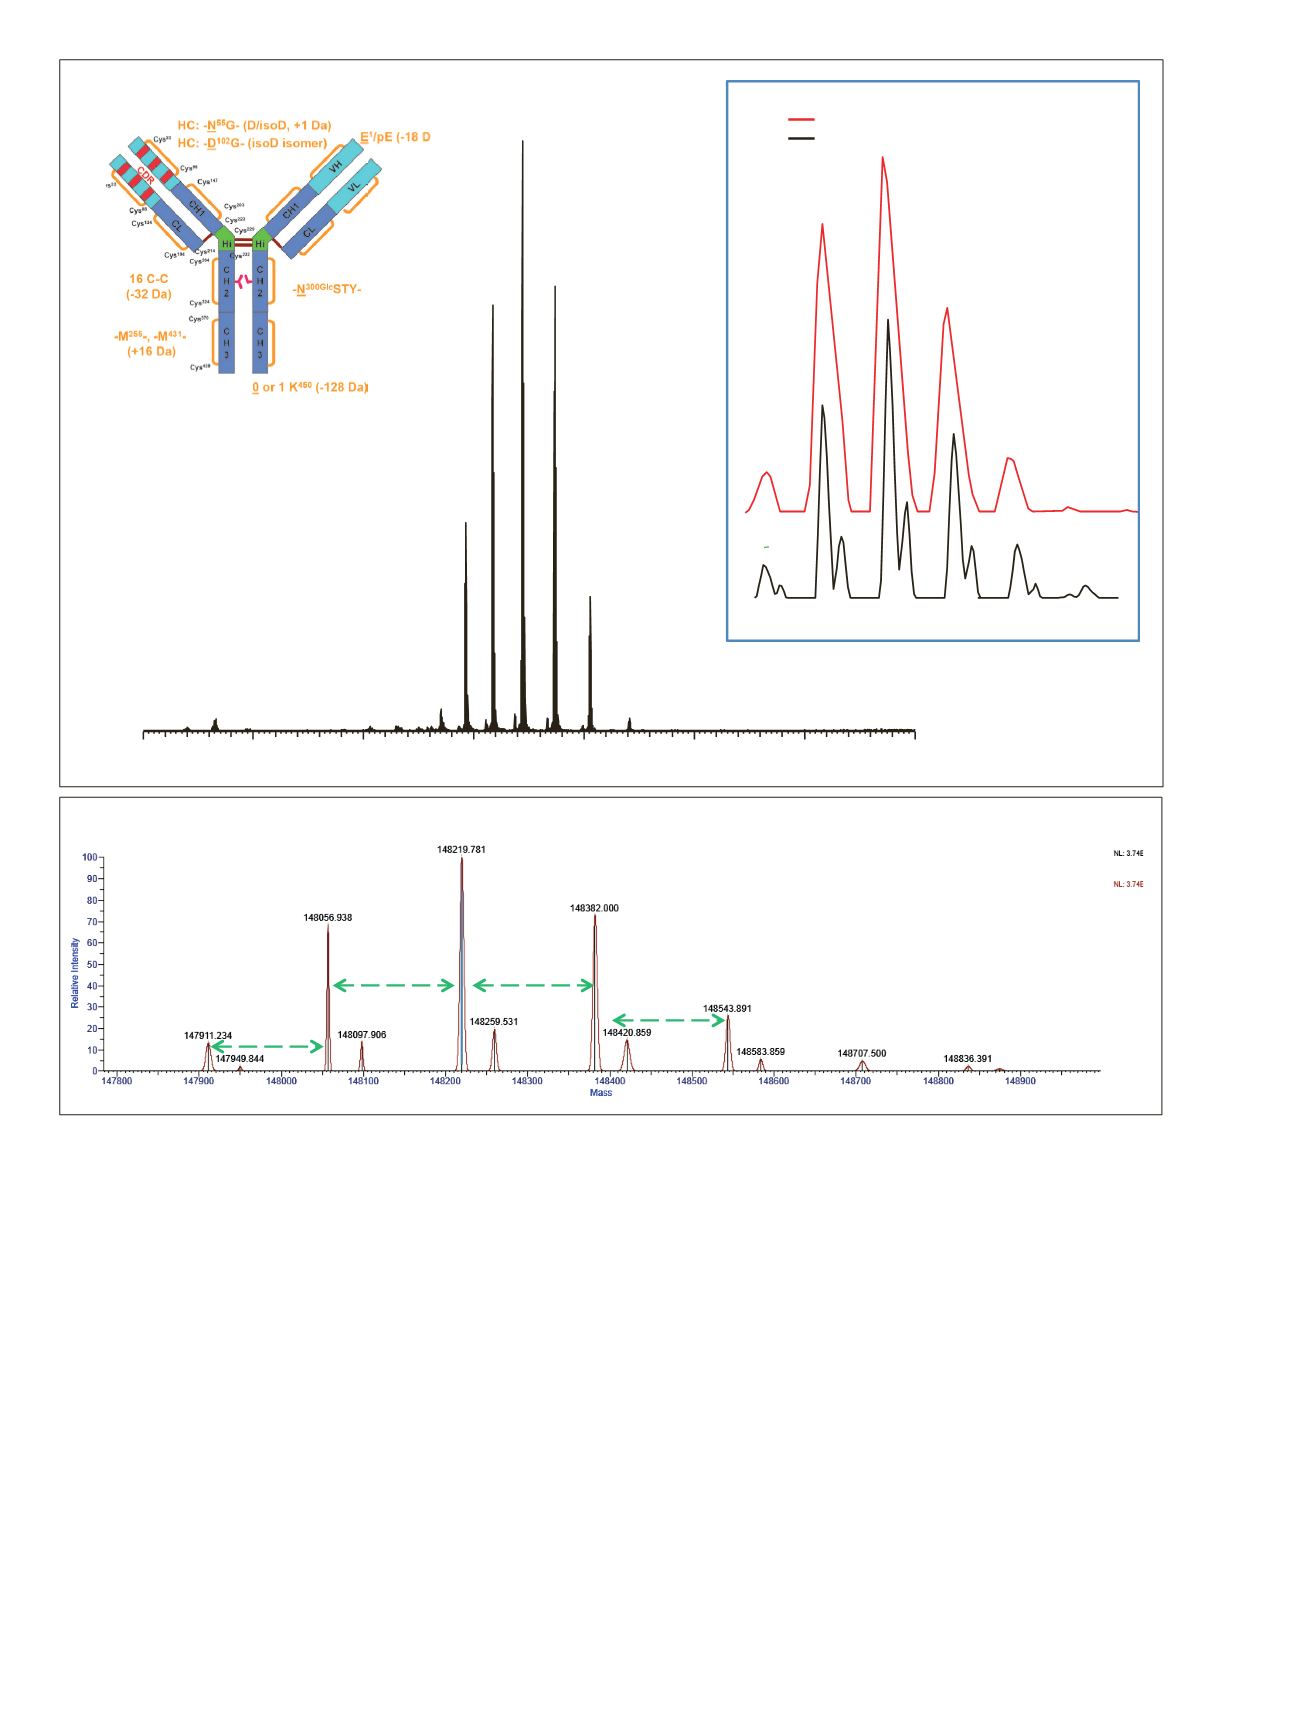
Figure 2. Orbitrap native MS detection of intact monoclonal antibody trastuzumab. A. Intact mAb trastuzumab. B. High-resolution,
native MS showing complete mass spectrum and zoom of corresponding 23
+
charge state. C. Deconvoluted spectrum showing
molecular weights of each trastuzumab glycoform with low ppm mass accuracy.
C
6560
H
10132
O
2090
N
1728
S
44
3000
4000
5000
6000
7000
8000
9000
10000
m/z
6445.4
6738.0
6176.8
5929.8
7058.9
5701.7
7411.7
4816.2
23+
G1F/G0F
6445.4
G0F/G0F
6438.3
G1F/G1F
6452.5
*
*
G2F/G1F
6459.3
*
G0/G0F
6431.9
*
*
G2F/G2F
6466.7
*+ 44 Da adducts
Zoom on 23
+
charge state:
Spectrumat 17,500 resolution
Spectrumat 35,000 resolution
Trastuzumab
G0F/G0F
5 ppm
G1F/G0F 9 ppm
G1F/G1F or (G2F/G0F)
10 ppm
G0/G0F
7.4 ppm
G1F/G2F
8.7 ppm
145.7 Da
162.8 Da
162.2 Da
161.9 Da
A
B
C


