8
To assess the limit of detection of the instrument setup
using the 250 x 0.2 mm monolithic PepSwift column, a
series of LC/MS runs were acquired. Between 50 pg and
20 ng of the intact antibody was applied on column
(Figure 8), starting with the lowest concentration. Two
blanks were run before the sequence and between each
sample to exclude carryover effects. With this setup,
500 pg was found to be the lowest amount that still
achieved a good spectrum for deriving the most abundant
glycoforms of the intact antibody. Here it is worth
pointing out that for the lowest concentrations it was
crucial to prepare the samples fresh without storing them
for several hours in the autosampler prior to analysis.
Light chain
Heavy chain
A
B
C
2020
2040
m/z
0
20
40
60
80
100
Relative Abundance
2028.00
2021.53
2034.56
10
11
12
13
14
15
16
17
18
19
20
Time (min)
0
10
20
30
40
50
60
70
80
90
100
Relative Abundance
16.96
14.57
11.15
10.07
17.38
16.10
11.44 11.98
12.63
17.93
13.17
18.45
18.98
19.45
14.18
20.21
15.18
x5
1000
1500
2000
2500
3000
m/z
0
10
20
30
40
50
60
70
80
90
100
Relative Abundance
2304.66
2560.31
1213.34
1536.83
1920.51
1152.82
1646.32
2095.17
1098.02
2880.87
960.89
1780.49
2661.69
#
1500
2000
2500
m/z
0
10
20
30
40
50
60
70
80
90
100
Relative Abundance
1810.86
1950.07
1690.16
2028.00
1584.58
1536.59
2112.45
2304.44
2414.12
2668.24
2816.35
2982.00
23025 23030 23035 23040 23045 23050
m/z
0
10
20
30
40
50
60
70
80
90
100
0
10
20
30
40
50
60
70
80
90
100
Relative Abundance
23025.3758
23038.3596
23028.6428
Light Chain
Monoisotopic mass
Heavy Chain
Average masses
Light Chain
Full isotopic distribution
2.9 ppm
-2.1 ppm
0.9 ppm
G0F
G1F
G2F
Figure 6. Chromatogram (
A
) and full MS spectra of light (
B
) and heavy chain (
C
) from reduced rituximab. The insert in panel C shows a
zoomed in view of charge state z=+25, with the three peaks representing three different glycoforms.
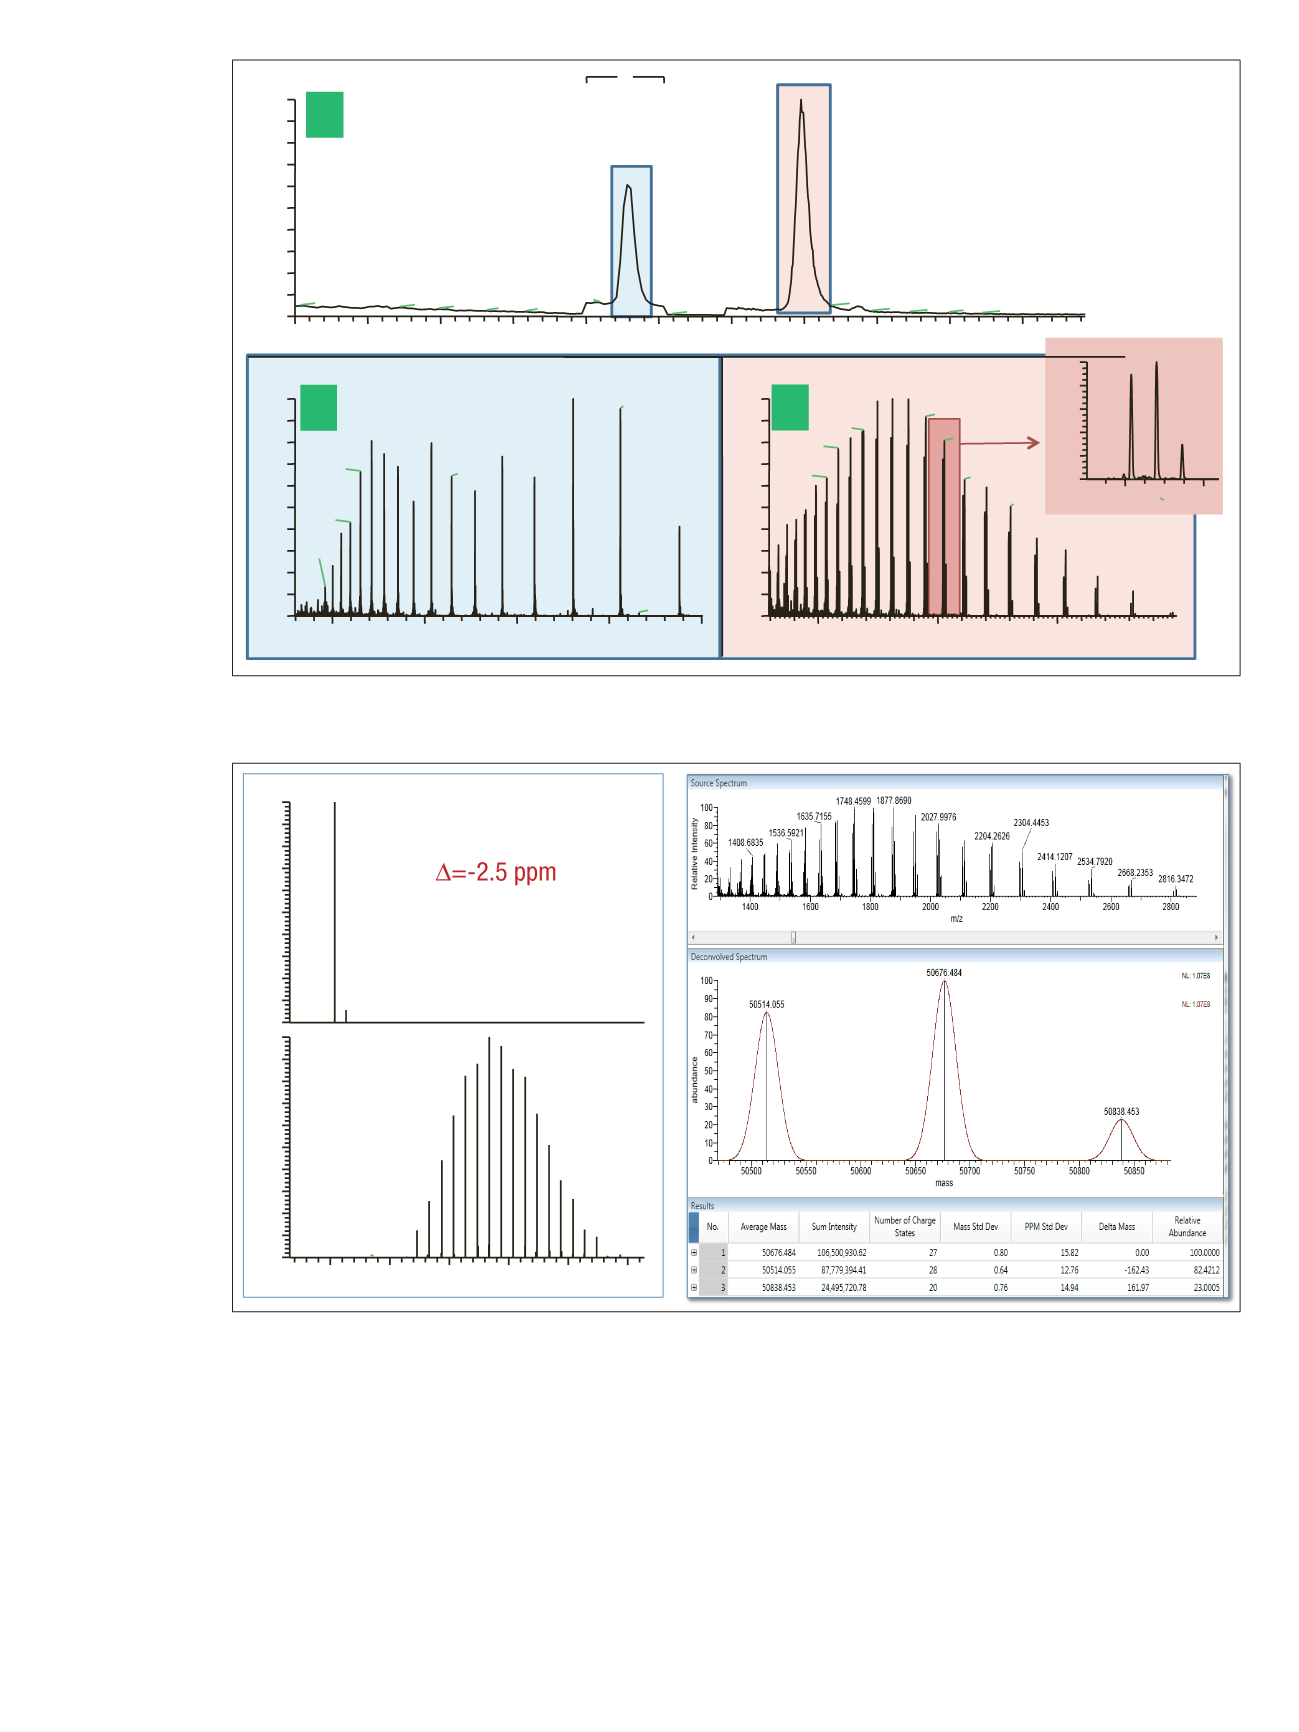
Figure 7. Deconvolution results of the light and heavy chain. The light chain, acquired at a resolution setting of 140,000 in full scan
mode, was deconvoluted using the Xtract algorithm, obtaining an accurate monoisotopic mass as well as the full isotopic envelope
(left). The heavy chain, detected at 17,500 resolution, was deconvoluted with the ReSpect algorithm providing average masses (right).


