4
The full MS spectrum obtained from 20 ng rituximab
applied to a 25 cm x 0.2 mm i.d. monolithic column is
displayed in Figure 3. The mass spectrum, acquired over
m/z
1800–5000 shows the typical charge distribution
observed for large proteins. The most abundant charge
state (z=+45) at
m/z
3269, represented in the zoomed in
insert, nicely pictures the four most abundant glycoforms
of the intact antibody.
The intact mass of these four most abundant glycoforms
and a series of less abundant glycoforms is obtained after
the deconvolution of the full MS mass spectrum shown in
Figure 4. The assignment of the peaks was based on the
calculation of the proteins sequence, taking into account
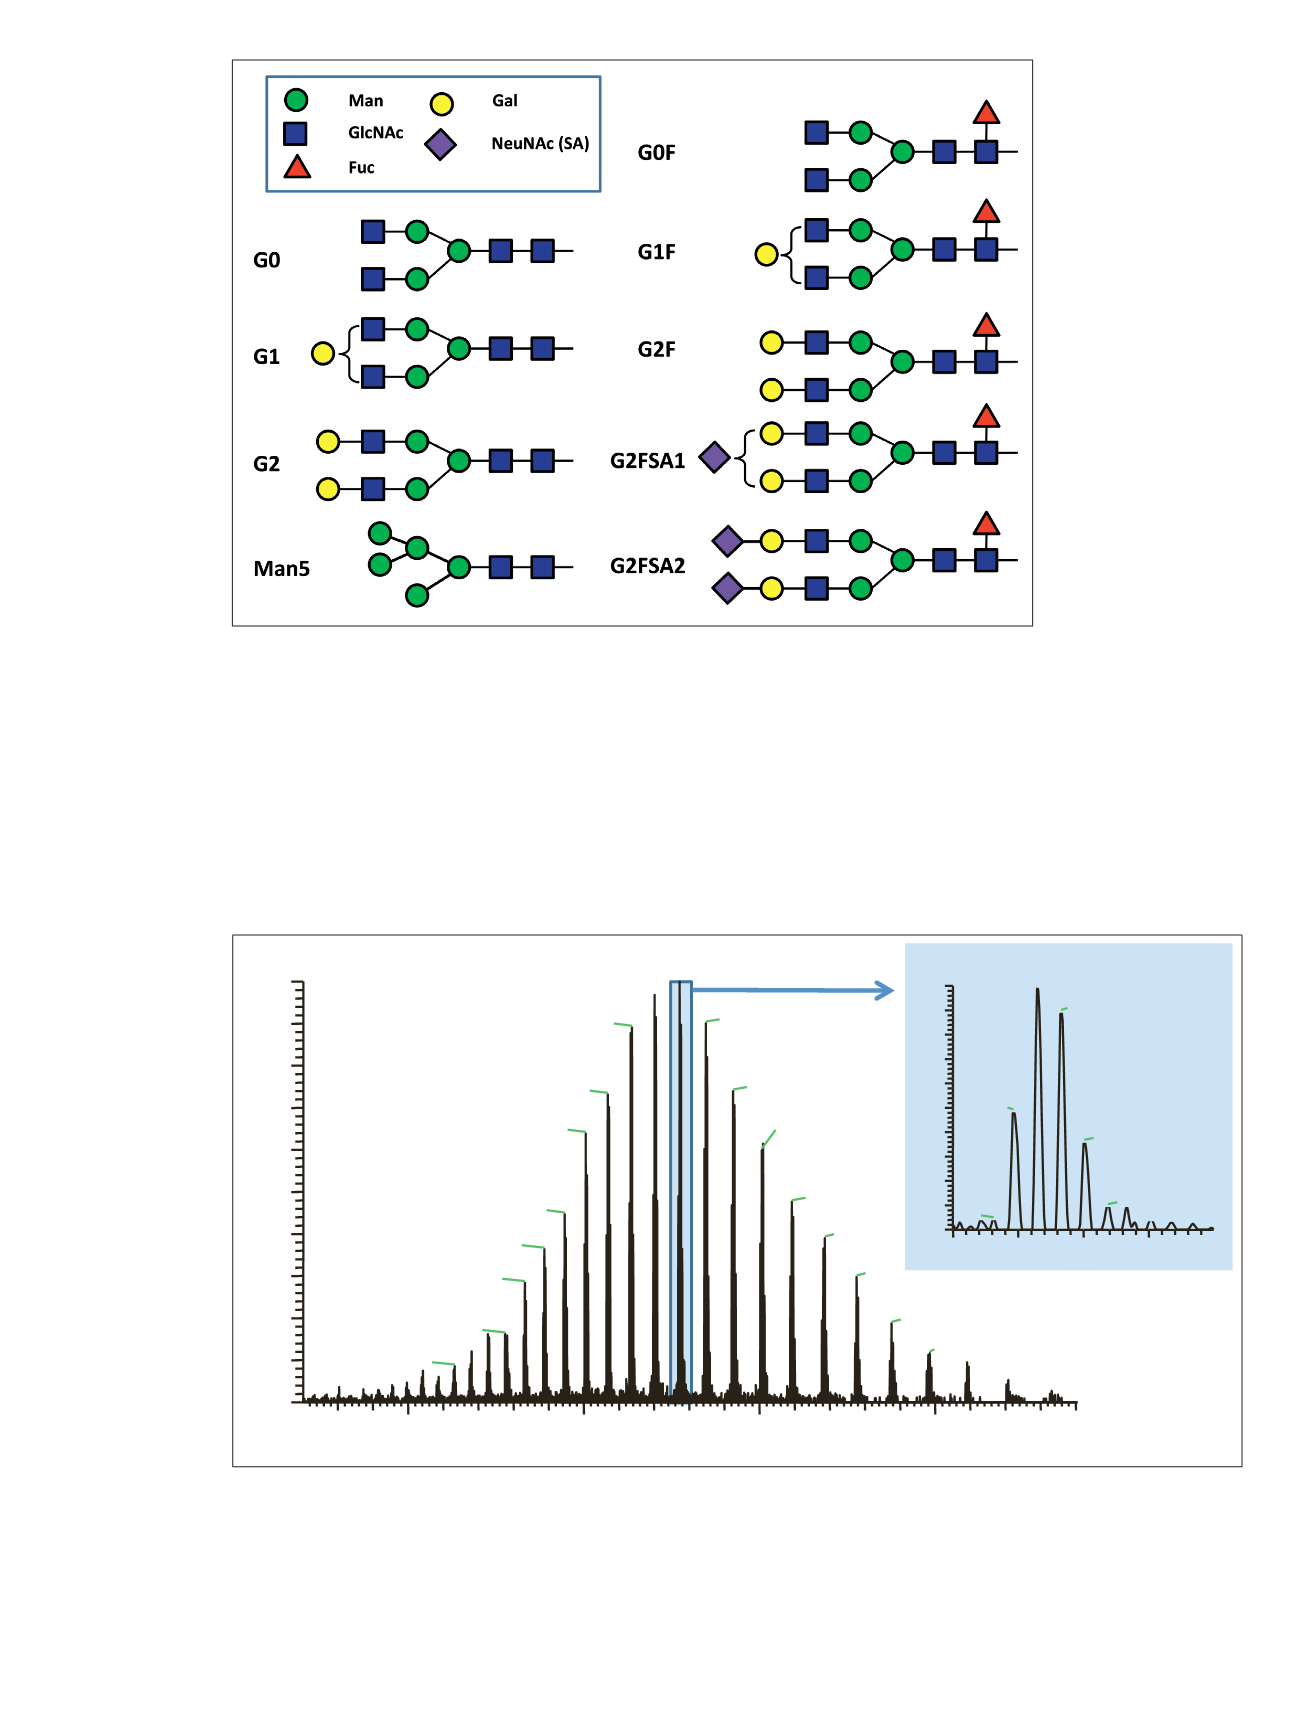
the various anticipated glycan structures shown in
Figure 2.
3260
3270
3280
3290
m/z
0
10
20
30
40
50
60
70
80
90
100
Relative Abundance
3272.96
3276.58
3269.31
3280.12
3283.74
3266.23
3290.26
zoom
2500
3000
3500
4000
m/z
0
10
20
30
40
50
60
70
80
90
100
Relative Abundance
3272.96
3347.33
3137.16
3425.13
3068.50
3005.83
3506.59
3592.19
2945.77
3686.06
2888.16
3776.35
2832.49
3875.98
2776.10
3984.74
2632.99
4208.14
2303.96
Figure 3. Single scan full MS spectrum (10 µscans) of rituximab, acquired from 10 ng sample loaded on a 250 x 0.2 mm i.d. column.
The insert shows a zoomed in view of the most abundant charge state (z=+45). The observed peak pattern in the insert represents the
different glycoforms of the molecule.
Figure 2. Nomenclature of carbohydrate structures commonly observed on antibodies


