AN63918_E 11/13S
Africa
+43 1 333 50 34 0
Australia
+61 3 9757 4300
Austria
+43 810 282 206
Belgium
+32 53 73 42 41
Canada
+1 800 530 8447
China
800 810 5118
(free call domestic)
400 650 5118
Denmark
+45 70 23 62 60
Europe-Other
+43 1 333 50 34 0
Finland
+358 9 3291 0200
France
+33 1 60 92 48 00
Germany
+49 6103 408 1014
India
+91 22 6742 9494
Italy
+39 02 950 591
Japan
+81 45 453 9100
Latin America
+1 561 688 8700
Middle East
+43 1 333 50 34 0
Netherlands
+31 76 579 55 55
New Zealand
+64 9 980 6700
Norway
+46 8 556 468 00
Russia/CIS
+43 1 333 50 34 0
Singapore
+65 6289 1190
Spain
+34 914 845 965
Sweden
+46 8 556 468 00
Switzerland
+41 61 716 77 00
UK
+44 1442 233555
USA
+1 800 532 4752
©2013 Thermo Fisher Scientific Inc. All rights reserved. ISO is a trademark of the International Standards Organization.Rituxan is a registered
trademark of Biogen Idec, Inc. USA. MabThera is a registered trademark of F. Hoffmann-La Roche Ltd. PicoTip is a registered trademark of
New Objective, Inc. SEQUEST is a registered trademark of the University of Washington. All other trademarks are the property of Thermo Fisher
Scientific and its subsidiaries. This information is presented as an example of the capabilities of Thermo Fisher Scientific products. It is not
intended to encourage use of these products in any manners that might infringe the intellectual property rights of others. Specifications, terms and
pricing are subject to change. Not all products are available in all countries. Please consult your local sales representative for details.
Thermo Fisher Scientific,
San Jose, CA USA is
ISO 9001:2008 Certified.
Application Note 591
Conclusion
In this study, a workflow is presented that combines fast
chromatography, using two sizes of monolithic columns,
and high resolution Orbitrap mass spectrometry of intact,
as well as reduced, rituximab, sequence verification by AIF,
and multiplexed HCD top-down fragmentation,
supplemented by a bottom-up approach.
The data presented here also demonstrate the sensitivity of
the applied LC-MS instrument setup, still obtaining a good
quality MS spectrum from as low as 500 pg of the intact
antibody loaded on column. Furthermore, for the analysis
of the reduced mAb, a chromatographic separation of the
light and heavy chains was achieved allowing for their
detection at different resolution settings.
The data obtained from this workflow allow the
determination of the molecular weight of the intact
antibody, the confirmation/verification of the amino acid
sequence of light and heavy chain, and the identification and
evaluation of the relative abundance of various glycoforms
of rituximab.
Acknowledgements
The authors would like to thank Daniel Pürstinger for his
help in sample preparation and Remco Swart for providing
the PepSwift and ProSwift monolithic columns used in
this study. The financial support by the Austrian Federal
Ministry of Economy, Family, and Youth and the National
Foundation of Research, Technology, and Development is
gratefully acknowledged.
References
1. Premstaller, A.; Oberacher, H. and Huber, C.G.
High-Performance Liquid Chromatography-
Electrospray Ionization Mass Spectrometry of
Single- and Double Stranded Nucleic Acids Using
Monolithic Capillary Columns.
Anal. Chem
.
2000
,
72
,
4386-4393.
2.
3.Nebija, D.; Kopelent-Frank, H.; Urban, E.; Noe, C. R.
and Lachmann, B. Comparison of two-dimensional gel
electrophoresis patterns and MALDI-TOF MS analysis
of therapeutic recombinant monoclonal antibodies
trastuzumab and rituximab.
Journal of Pharmaceutical
and Biomedical Analysis
,
2011
,
56
, 684–91.
4. Kuribayashi, R.; Hashii,
N
.; Harazono, A. and
Kawasaki,
N
. Rapid evaluation for heterogeneities in
monoclonal antibodies by liquid chromatography/mass
spectrometry with a column-switching system.
Journal
of Pharmaceutical and Biomedical Analysis,
2012
,
67-68
, 1–9.
-Hex
-Hex
-HexNAc
-Fuc
-Hex
HexNAc
oxonium
Hex-HexNAc
oxonium
EEQYNSTYR
EEQYNSTYR
-Fuc
-HexNAc
1318
1320
m/z
0
20
40
60
80
100
120
140
160
RelativeAbundance
1318.0284
z=2
1317.5272
z=2
1318.5300
z=2
1319.0314
z=2
1319.5328
z=2
879
880
881
m/z
0
10
20
30
40
50
60
70
80
90
100
RelativeAbundance
879.0214
z=3
878.6874
z=3 879.3555
z=3
879.6898
z=3
880.0225
z=3
881.2059
z=?
Intact glycopeptide
precursor MH
2+
/MH
3+
Dppm= 0.47
Dppm= 0.67
200
400
600
800
1000
1200
1400
1600
1800
2000
2200
m/z
0
10
20
30
40
50
60
70
80
90
100
Relative Abundance
1392.5940
z=1
1538.6495
366.1400
2066.8406
563.3297
z=1
1919.7865
1189.5182
z=1
1595.6632
-Fuc
204.0868
GOF
EEQYNSTYR
EEQYNSTYR
EEQYNSTYR
EEQYNSTYR
EEQYNSTYR
EEQYNSTYR
EEQYNSTYR
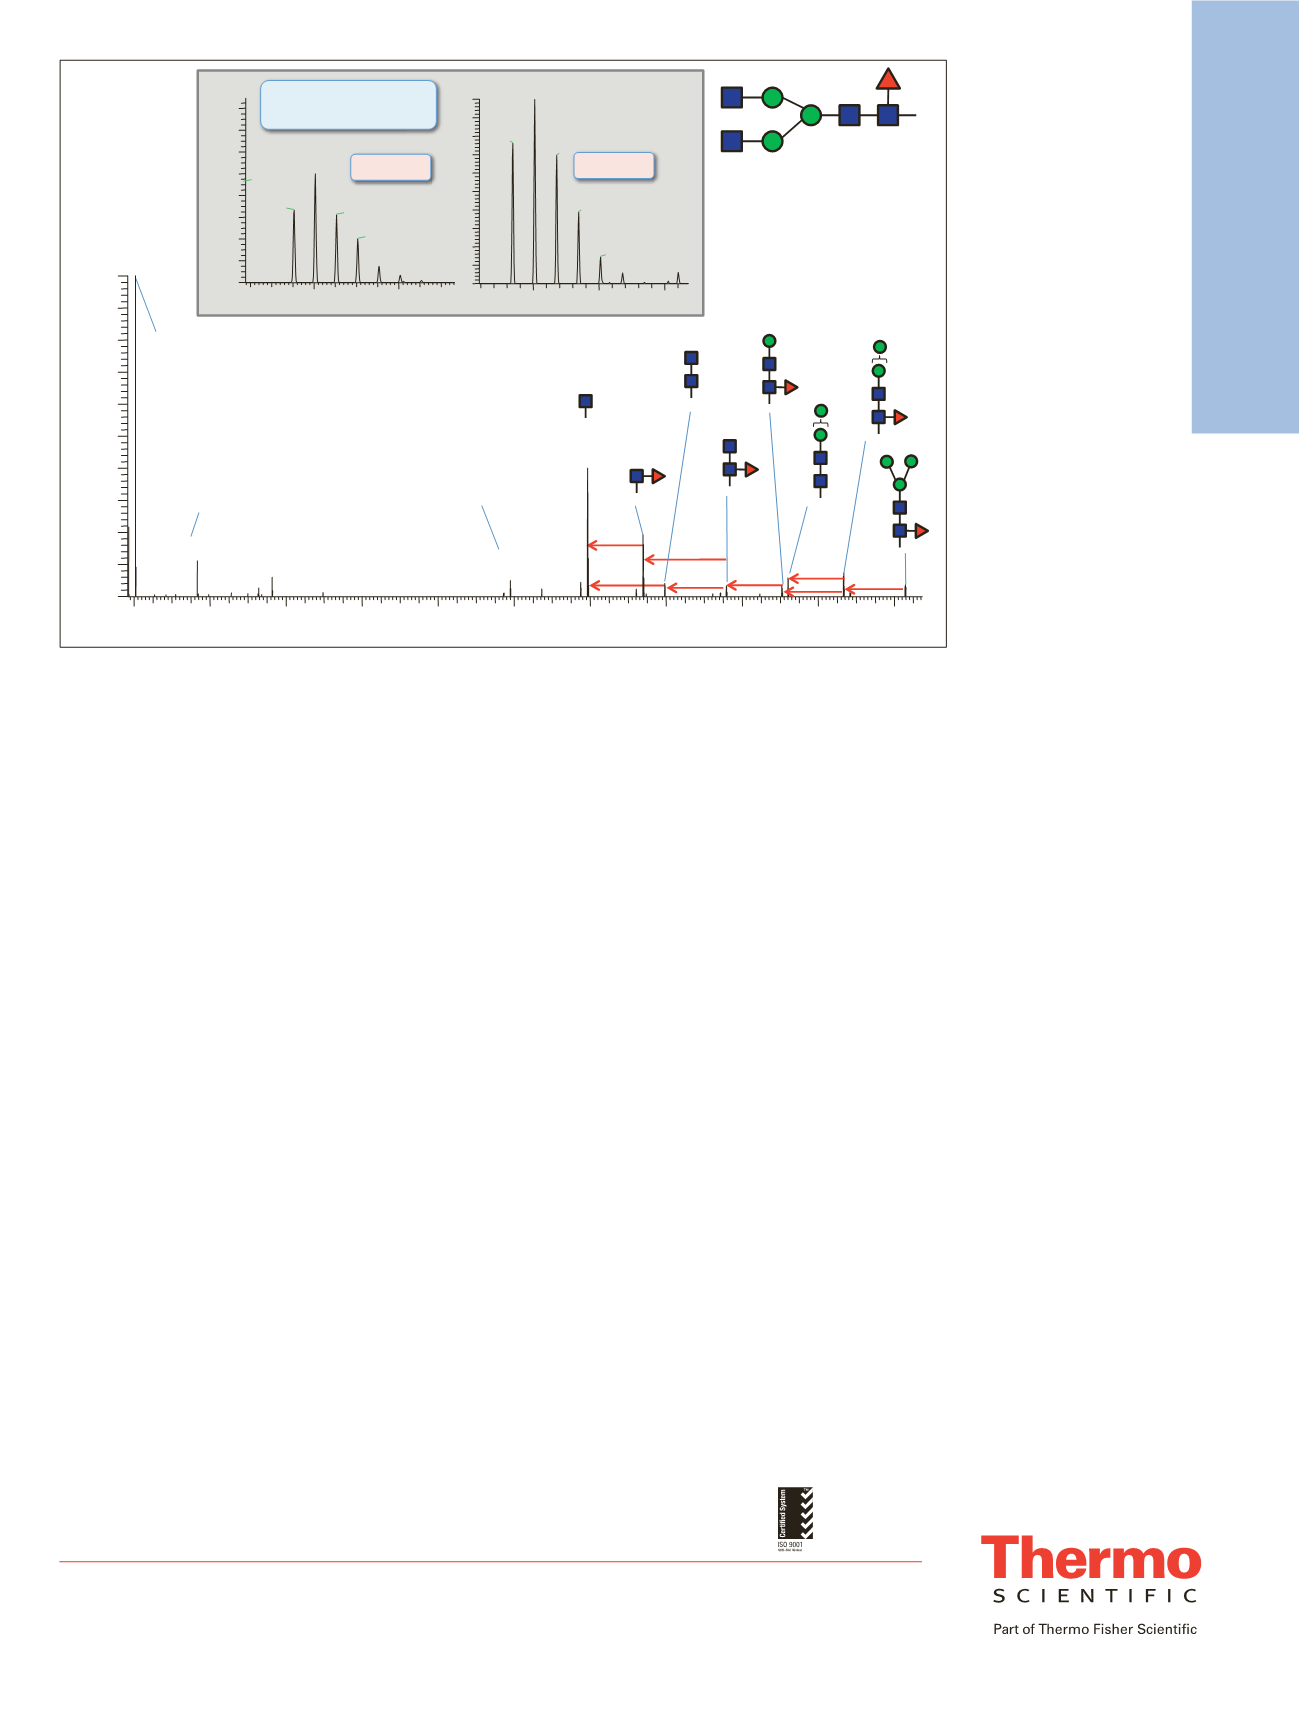
Figure 13. MS/MS spectrum of the glycopeptide aa 297-305 (EEQYN*STYR, *=G0F) obtained from the triply charged
glycopeptide precursor. Inserts show the isotope patterns of doubly and triply charged intact precursors detected in the full
scan spectrum.


