5
Orbitrap Native MS Analysis of Immune
mAb/Antigen Complexes
Native MS can also be used to analyze mAb/antigen
(mAb/Ag) complexes, providing additional information
including mAb/antigen binding stoichiometries, specificities
and affinities.
4
These properties are essential for originator
and biosimilar candidates comparison studies. ESI-MS
presents the advantage to allow the direct observation of
noncovalent immune complexes without any chemical
modification. J10.4 is a commercial mouse monoclonal
IgG1 raised against recombinant JAM fusion protein of
human origin that is recommended for detection of JAM-A
by western blotting and immunopurification techniques.
JAM-A, used here as antigen, is a single transmembrane
protein belonging to the immunoglobulin superfamily.
JAM-A localizes in tight junctions in normal epithelial
and endothelial cells where homophilic JAM-A interactions
have been shown to be important for regulation of epithelial
barrier function.
4,5
This newly identified target is over-
expressed in many tumor tissues and therefore is of prime
interest as a target in oncology. Two JAM-A molecules are
expected to bind to one J10.4 mAb.
The native mass spectrum of mAb/antigen complexes was
recorded at a resolution of 35,000 with the in-source CID
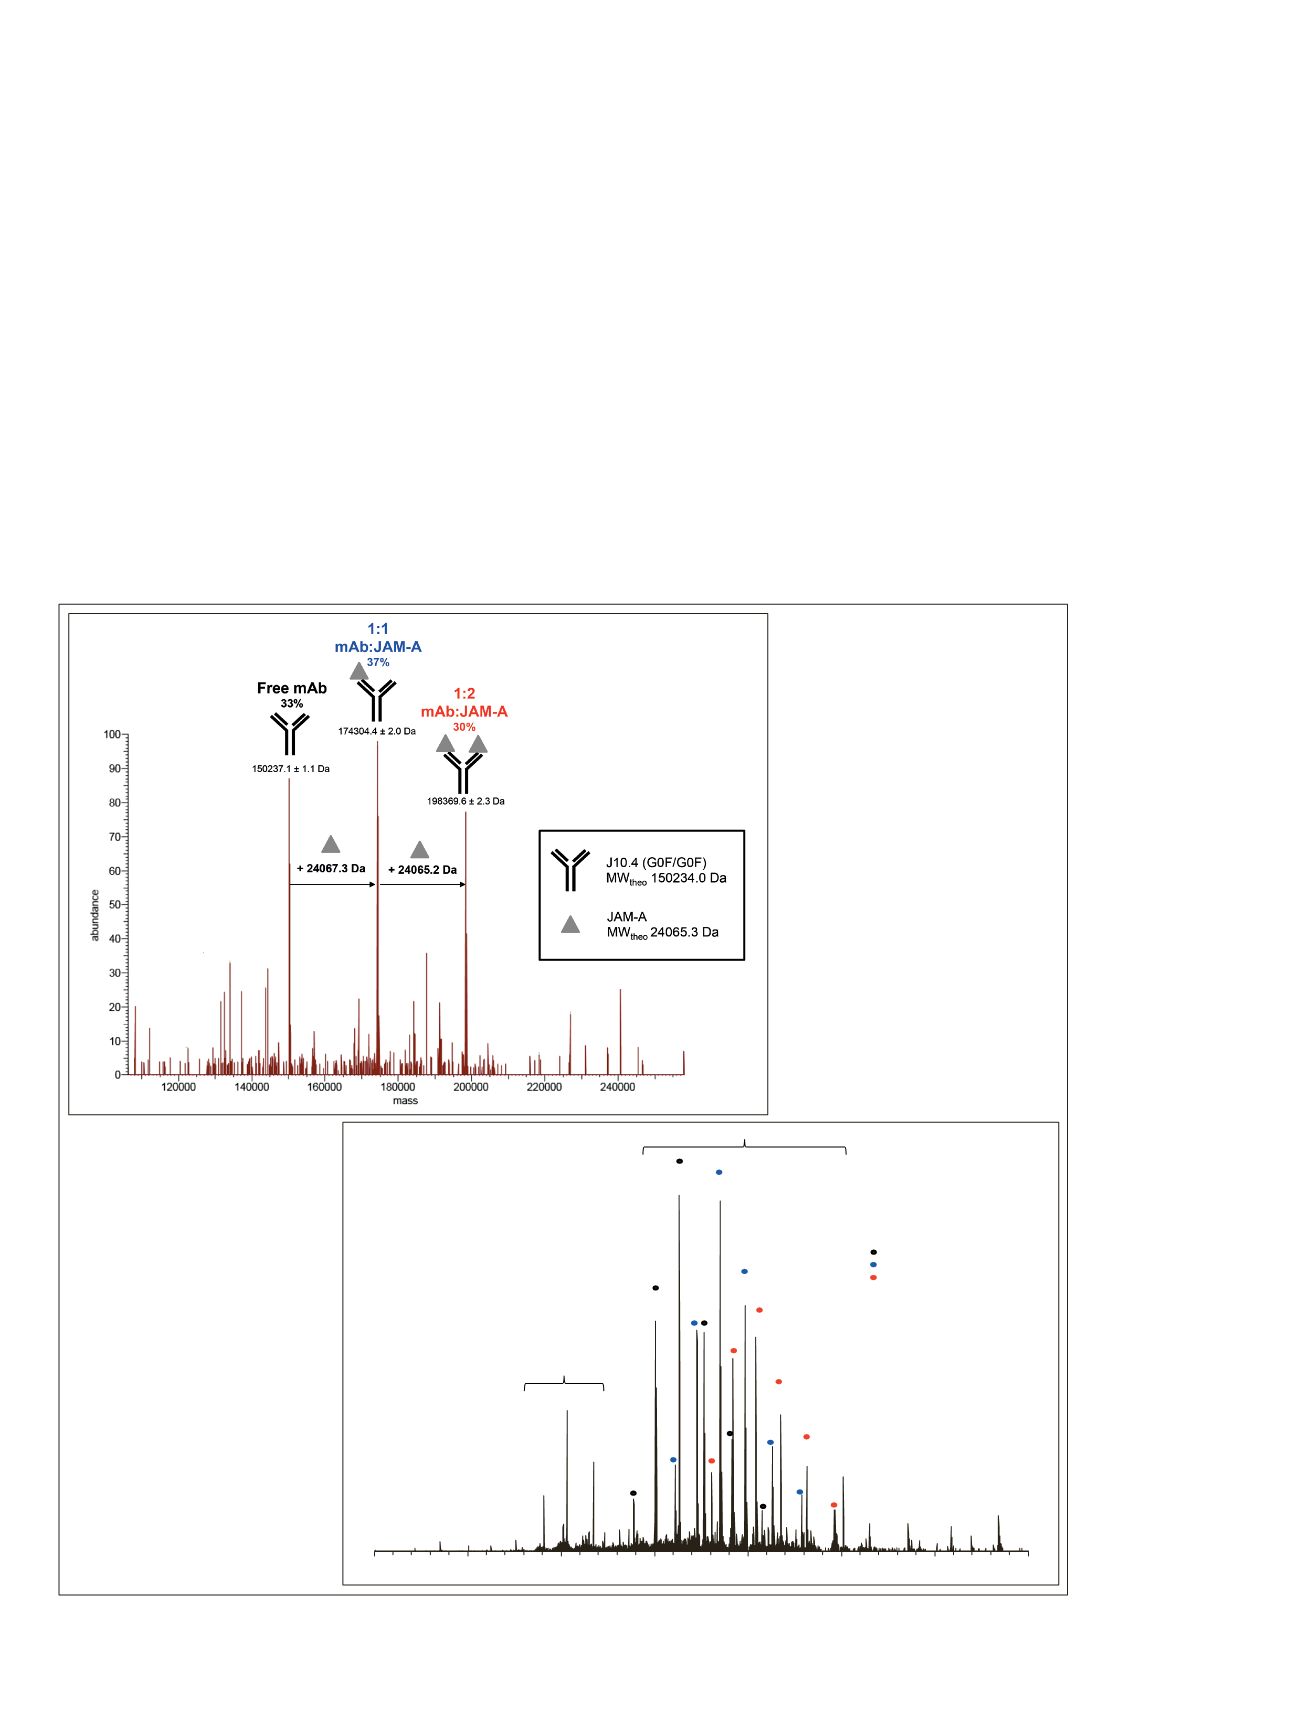
voltage set to 150 eV. As shown in Figure 4A, when an
4-fold excess of JAM-A (20 µM) is added to J10.4 mAb
(5 µM), three species are detected: the intact free mAb
(MW 150237.1 ± 1.1 Da, black), 1:1 (MW 174304.4 ± 2.0
Da, blue) and 1:2 (MW 198369.6 ± 2.3 Da, red) mAb:JAM-A
complexes. Native MS thus confirmed that two JAM-A
molecules can bind to J10.4 mAb. MWs correspond to the
main G0F/G0F glycoforms. Relative abundances were
estimated from MS peak intensities and proportions of
mAb:Ag complexes at 1:1 and 1:2 stoichiometries were
observed to be 37% and 30%, respectively, while free mAb
represents 33%. Figure 4B shows the corresponding mass
spectrum with the entire charge state distribution in native
conditions.
Figure 4. Orbitrap native MS detection of immune mAb/antigen complexes. A. Deconvoluted mass spectrum showing mAb/antigen
binding stoichiometries. B. Charge state distribution in native conditions.
3000
4000
5000
6000
7000
8000
9000
m/z
26+
6704.8
24+
6260.8
25+
6973.1
25+
6010.4
28+
7085.7
5067.1
27+
7348.0
5348.6
26+
7630.6
4813.9
J10.4 : JAM-A (1:0)
J10.4 : JAM-A (1:1)
J10.4 : JAM-A (1:2)
Free antigen
Region of mAb/Ag complexes
10000
A
B


