4
Analysis of Monoclonal Antibodies, Aggregates, and Their Fragments by Size Exclusion Chromatography Coupled with an Orbitrap Mass Spectrometer
Separation of mAb2 dimer aggregate and monomer was achieved on a short SEC
column (2.1
㽢
150 mm) within 8 min (Figure 2a). Both dimer aggregate and monomer
were successfully detected (Figure 2b and 2d). The deconvoluted spectra of
aggregates show dimer peaks at mass 296,785 u and 297,105 u (Figure 2c),
corresponding to the homo-dimers of monomers at mass148,393 u and 148,554 u
(Figure 2e). The mass differences between measured mass and calculated mass
derived from the monomer mass are 3 and 7 ppm respectively. In addition, the dimer
aggregate peak at mass 296,949 u corresponds the hetero-dimer of monomers at
mass 148,393 u and 148,554 u.
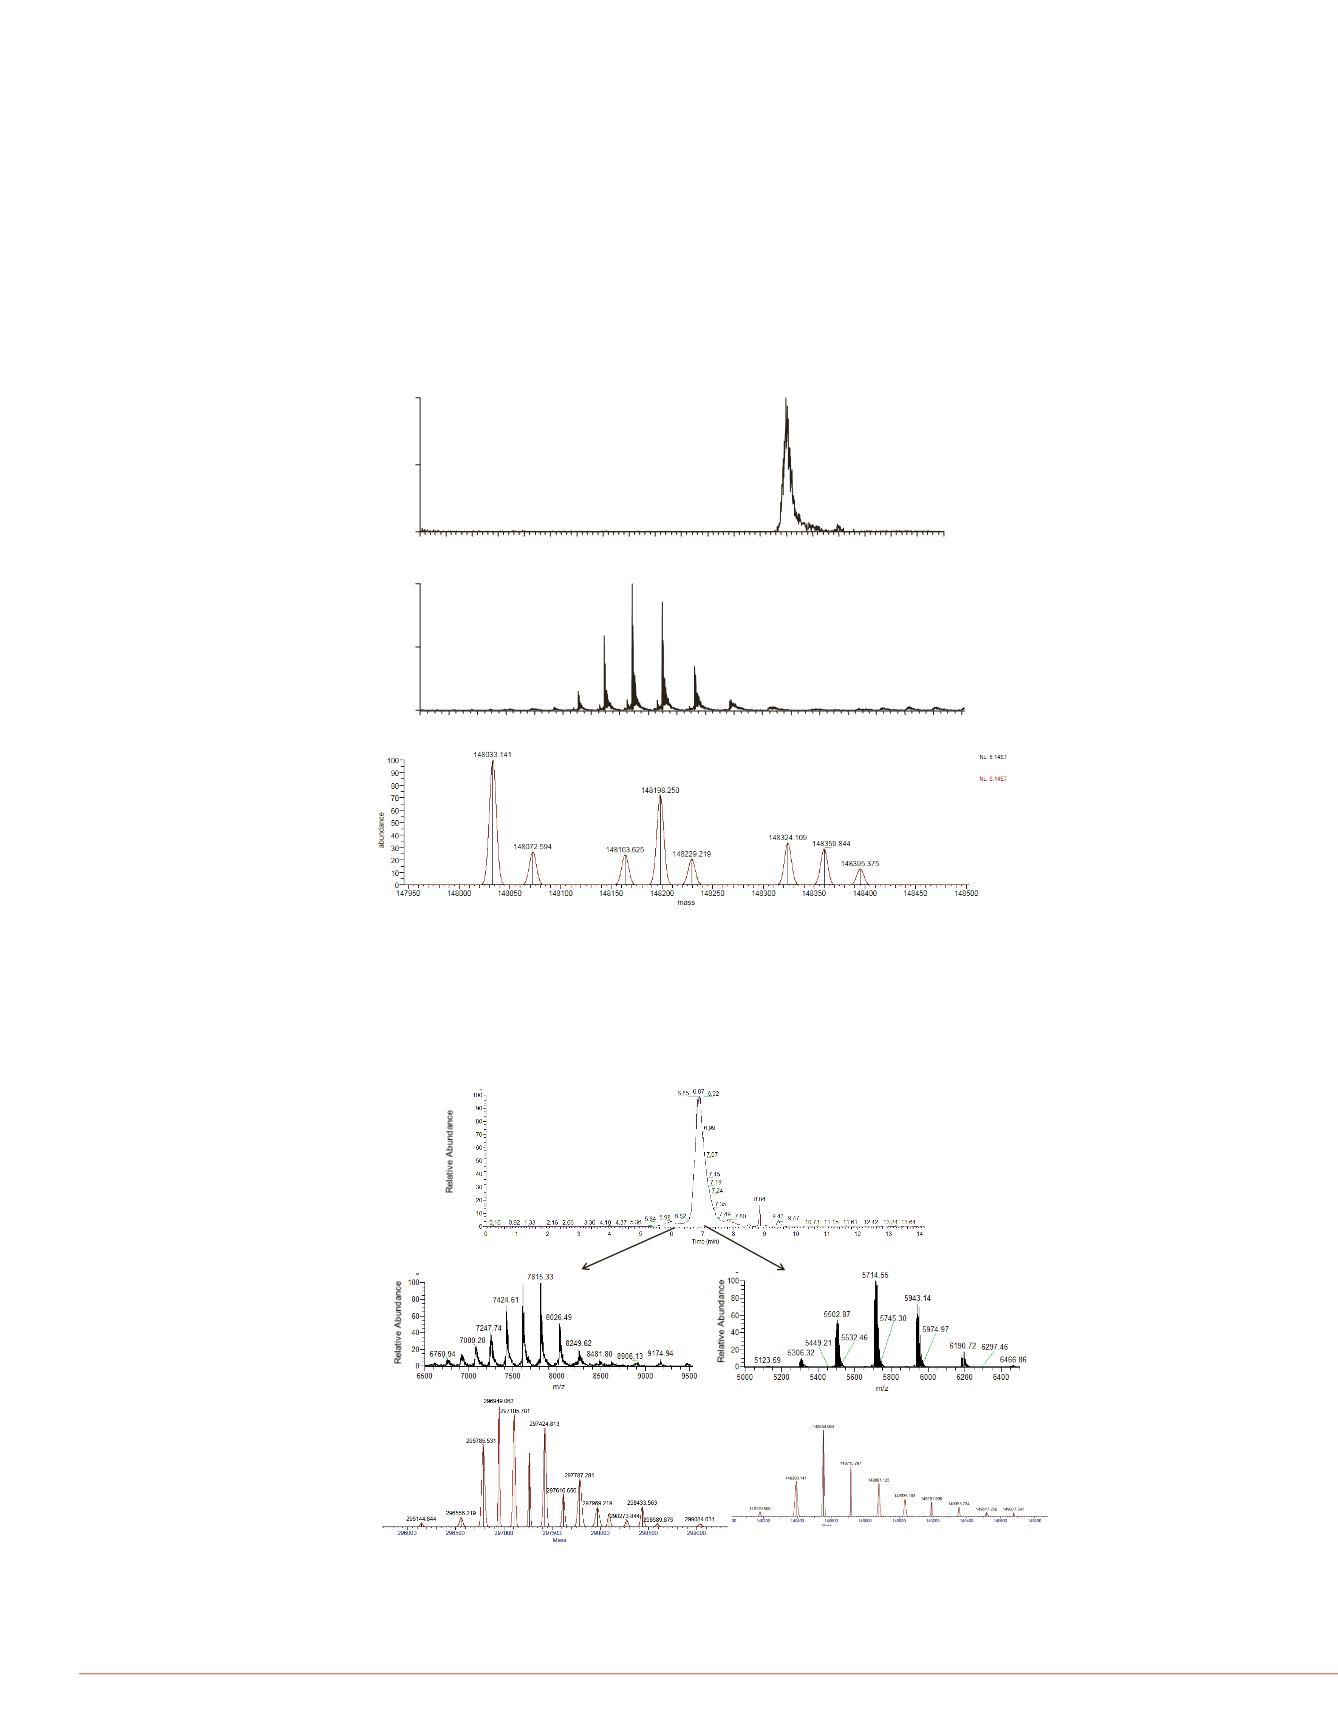
FIGURE 1: SEC-MS analysis of mAb1 under non-denaturing condition using
20 mM NH
4
HCO
2
.
mAb was injected onto a MAbPac SEC-1 4 x 300 mm column and
the flow rate was set at 200 µL/min
.
(a) extracted ion chromatogram of mAb, (b) mass
spectrum of mAb, (c) deconvoluted spectrum of mAb.
mo Scientific™ Dionex™
UltiMate
™
00 Membrane Degasser, NCS-
tment , and WPS-3000TPL Rapid
lysis was carried out in isocratic
set at 200 µL/min. For the 2.1 mm ID
ht chain (LC) subunits
g/mL) was achieved by incubation of
duced sample was acidified with
Fc subunits
(1 mg/mL) with papain (0.04 mg/ml)
M Cysteine buffer at 37
C. After
formic acid to final concentration at
fluoroacetic acid acid (TFA).
used for this study. Intact mAb or
probe was used. See Table I for
Fc fragments were analyzed using
re (v 3.0) that utilizes the ReSpect
Analysis of mAb fragment
Comprehensive analysis of t
deamidation, C-terminal lysin
oxidation, and glycosylation,
all the peptides. However, “p
way to analyze the mAb vari
heavy chain and light chain,
generated by the reduction o
digestion. For example, the
chain, glycan variants can be
profiles, while light chain and
polypeptide chain.
Figure 3 shows the SEC-MS
0.1% formic acid, and 0.05%
HC with
m/z
at 3163.70-316
denaturing eluent system, m
about 12.71 min. Different m
retention time. Therefore, de
separation of HC and LC of
the
m/z
range of 1900-3600
mAb HC, with a main peak a
and 50,776.4 u, correspondi
additional hexose. The lysin
shows the charge envelope
shows the deconvoluted mas
23,403.7 u. The mAb light c
variants. The intact mass of
2x(HC+LC)-8. The calculate
mass 148,035 u.
FIGURE 3: SEC-MS analysi
denaturing condition usin
trifluoroacetic acid.
mAb w
and the flow rate was set at
chain (HC) and light chain (L
deconvoluted spectrum of he
(e) deconvoluted spectrum o
0
2
4
6
8
10
12
14
16
18
20
Time (min)
0
50
100
Relative Abundance
13.99
14.04
13.92
14.14
14.23
15.96
4000
4400
4800
5200
5600
6000
6400
6800
7200
7600
m/z
0
50
100
Relative Abundance
5483.64
5694.50
5287.83
5922.28
5500.86
5712.75
5105.51
5942.16
5310.31
6176.10 6468.60
7432.03 7616.74
4941.10
7251.92
6768.23
(a)
(b)
+27
+26
+25
+28
+29
+24
+23
(c)
G0
G1
G0+Lys
G1+Lys
G2
ed under non-denaturing conditions
nly used buffer is phosphate buffer
ture of phosphate buffer and high salt
line mass spectrometry detection.
h as 20 mM ammonium formate for
lumn to the Exactive Plus EMR
s of mAb1, with Figure 1a showing
8-5483.31 and Figure 1b showing the
f 5100-6200. Normally under acidic
/z
range of 2000-4000. Since the
al pH (at 6.3), the charge envelope of
of such high
m/z
charge envelope
ded mass range of the Orbitrap
ass spectra of the mAb, with a main
ass 148,198 u, and mass148,359 u,
2 additional hexoses. The adjacent
peak, corresponding to a lysine
MR Orbitrap mass spectrometer was
e employed for all measurements:
-8V; Inter Flatapole Lens: -7V; Bent
in the tune file were set as default.
FIGURE 2: SEC-MS analysis of mAb2 dimer aggregate and monomer under non-
denaturing condition using 20 mMNH
4
HCO
2
.
mAb was injected onto a MAbPac
SEC-1 2.1 x 150 mm column and the flow rate was set at 50
µL/min.
(a) extracted ion
chromatogram of mAb monomer and dimer. (b) mass spectrum of mAb dimer, (c)
deconvoluted spectrum of mAb dimer. (d) mass spectrum of mAb monomer, (e)
deconvoluted spectrum of mAb monomer.
n-denaturing, MAb Dimer Denaturing
On
z 2,000–15,000
m/z 400–6,000
kV
4.3 kV
arb. units
30 arb. units
rb. units
10 arb. units
5 °C
275 °C
0
200
0 eV
100 eV
0
n/a
1
10
6
1 × 10
6
0 ms
200 ms
,500
17,500
0 °C
200 °C
dimer
monomer
(a)
(b)
(d)
(c)
(e)
+27
+38
+26
+25
+24
+28
+37
+39
+40
G1
G0
G0+G1
2G0
2G1
RT:
6.88 -16.56
7.0
7.5
8.0
8
0
10
20
30
40
50
60
70
80
90
100
RelativeAbundance
8.5
7.02 7.41
8.11
7.84
1200
1400
1600
1800
2000
2200
2400
2600
2800
m/z
0
10
20
30
40
50
60
70
80
90
100
RelativeAbundance
2109.96
2201.64
1947.72
2301.67
2531.73
1875.65
2411.25
2664.91
2812.90
1808.68
1746.42
1688.25
1557.72
2323.12
2839.
1110.59
1340.65
Full MS
(a)
(b)
G0
G1
G0+Lys
G1+Lys
(c)
+20
+18


