2
Monoclonal Antibody and Related Product Characterization under Native Conditions using a Benchtop Exactive Plus EMR MS
Overview
Purpose:
Demonstrate the characterization of mAbs, antibody-drug conjugates (ADCs),
mAb/antigen (mAb/Ag) complexes, and a mixture of mAbs under their native conditions
b i
hi h l ti
t
(HRAM) b ht
t
t
ith
Chip-based infusion conditi
Instrumentation
Direct-Infusion Native MS C
y us ng a g -reso u on, accura e-mass
enc op mass spec rome er w
extended mass range (EMR).
Methods:
All antibodies and their related products samples were introduced using an
Advion TriVersa NanoMate with chip based nanospray ionization in the positive mode to
the Thermo Scientific
TM
Exactive Plus
TM
Extended Mass Range mass spectrometer.
Ionization voltage 9kV)
Gas pressure (psi)
Th ESI Chi R i t f
Thermo Scientific
TM
Orbitrap
TM
detection parameters were set according to the type of
analyte measured. Deconvolution of signals measured for determination of molecular
masses and relative abundances of the analytes were carried out using Thermo
Scientific™ Protein Deconvolution software.
R lt
I th l i (0 3 5 i ) i
th E ti
Pl
EMR MS l
l
i ht
e
p cons s s o an
diameters.
MS conditions
Instrumentation
esu s:
n e ana ys s . – m n us ng e xac ve us
, mo ecu ar we g
measurements of mAb and related products in the low ppm mass deviation range allowed
the identification of all species simultaneously present in solution. The number of drug
antibody ratio (DAR) and relative abundance of mAb/Ag complexes was also assessed
with the peak intensities serving for relative quantification of the detected species.
Mass Range
Resolution
Introduction
Native mass spectrometry (MS) has emerged as a valuable technique for
characterization of intact non-covalent protein complexes, reaching a high level of
reliability within the last ten years [1] For the analysis of intact monoclonal antibodies
Target value
Microscans
Maximal injection time (ms)
Insource CID energy (eV)
.
(mAbs), native MS yields accurate mass measurements of the molecules, glycoform
identification, and assessment of higher-order structures (dimer, trimer, tetramer), thus
providing a robust, fast, and reliable first-line analytical characterization tool. [2,3]
This poster describes the use of a new Orbitrap mass spectrometer with an extended
S-lens level (%)
mass range of up to
m/z
20,000 and improved detection of high-mass ions for the
characterization of mAbs, ADCs, mAb/Ag, and mAb mixtures under native conditions.
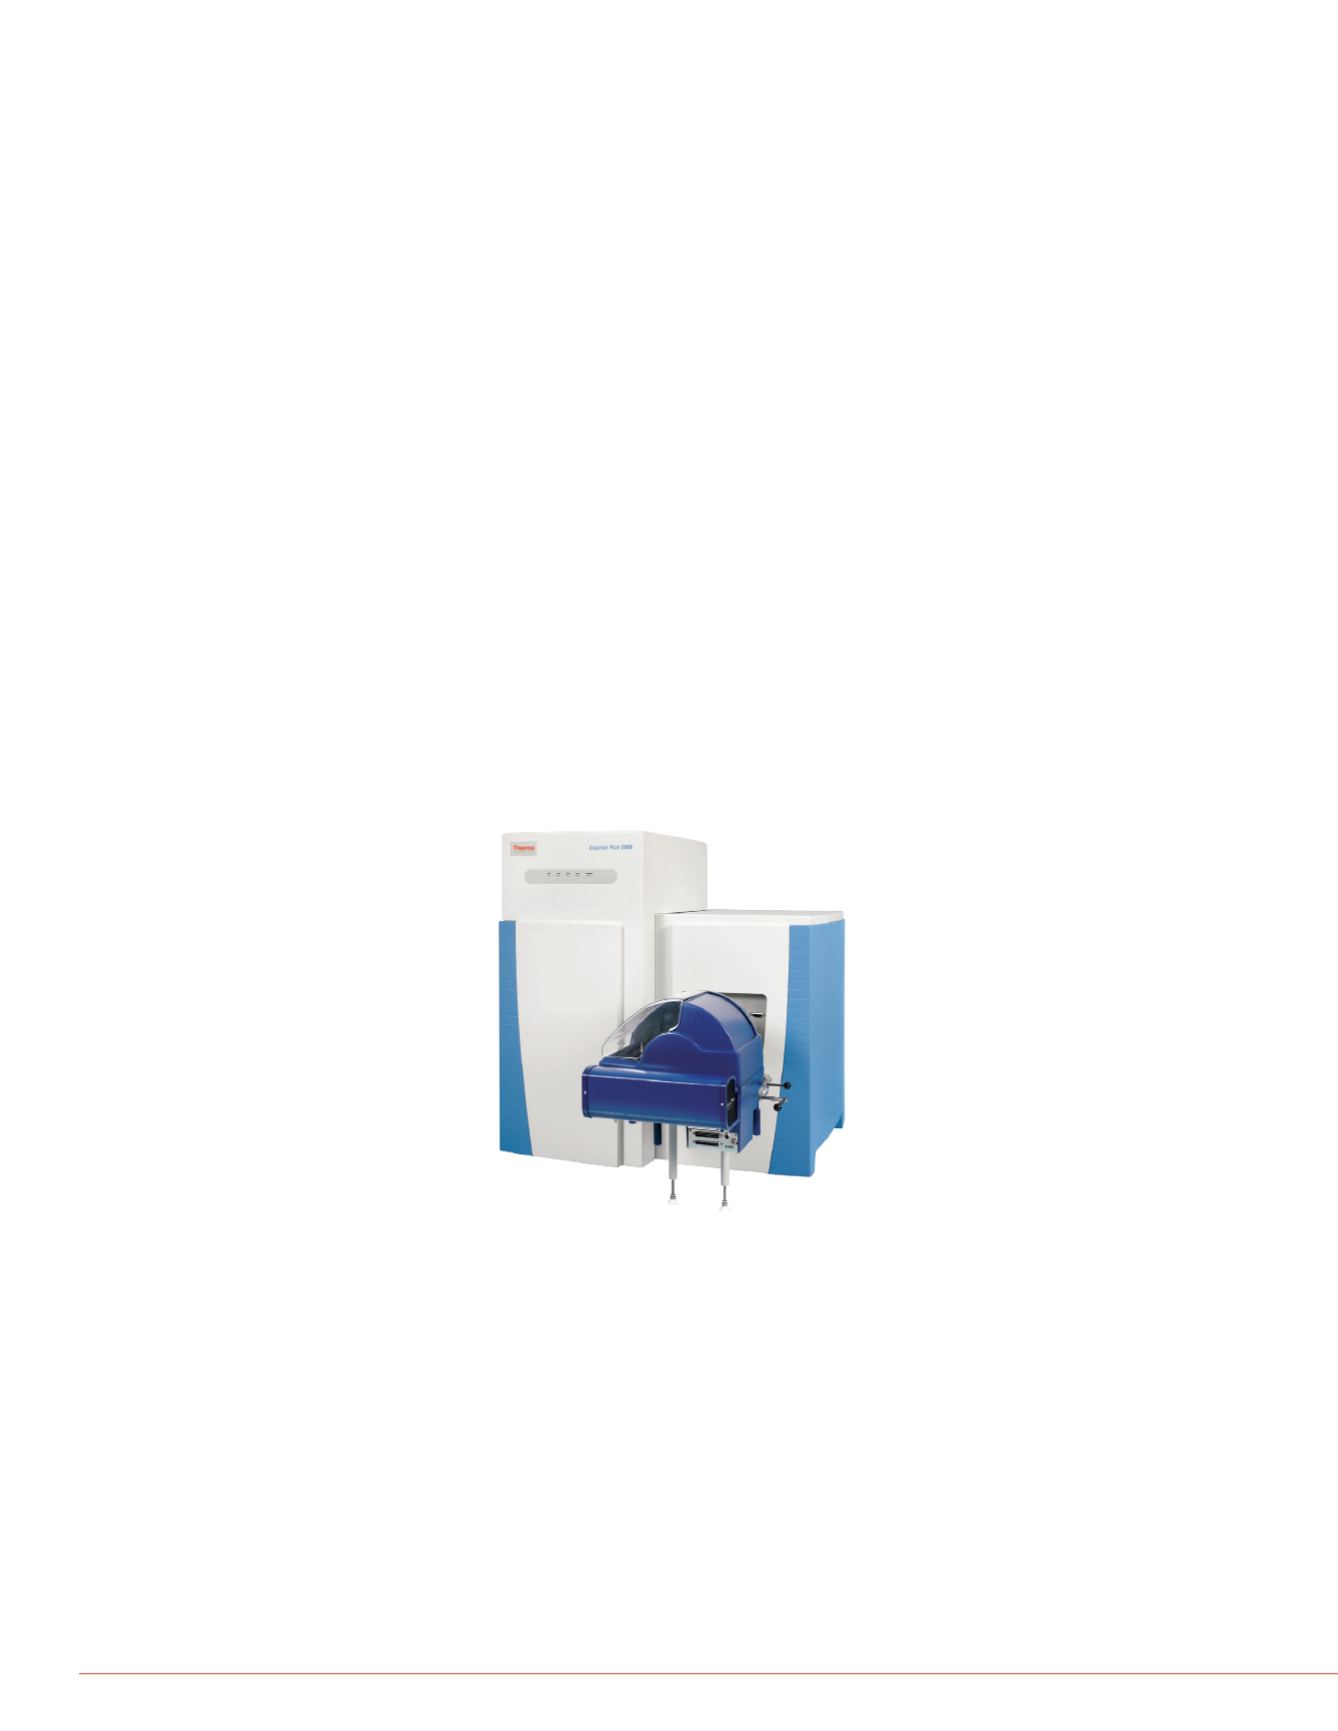
FIGURE 1. Exactive Plus EMR mass spectrometer equipped with a TriVersa
NanoMate chip-based electrospray ionization interface
Trapping gas pressure setting
Spectra average
D t A l i
a a na ys s
Software
Deconvolution parameters
Number of iterations
Noise compensation
Minimum adjacent charges
Results
High-Resolution Native MS A
Trastuzumab was analyzed on t
17,500 and 35,000 (Figure 2A).
resolved at 17,5000 resolution.
resolution, 35,000. Molecular w
measured with good mass accu
Methods
S l P ti
mass differences between speci
or to the addition of multiple hex
Orbitrap Native MS Analysis o
Brentuximab Vedotin
amp e repara on
The intact trastuzumab (Herceptin®, Roche), the monoclonal antibody-drug conjugate
(ADC) brentuximab vedotin (Adcetris®, Seattle Genetics), the mAb/antigen complexes of
J10.4 mAb/JAM-A, and one mixture of eleven distinct IgG antibodies were introduced
using the TriVersa NanoMate® into the Exactive Plus EMR Orbitrap mass spectrometer.
The brentuximab vedotin mass
source CID voltage was set to 7
spectrum of the deglycosylated
six (red), and eight (green) mole
with a mass difference between
Titration experiments involving J10.4 mAb and JAM-A were monitored by native MS. The
fixed amount of J10.4 (5 μM) was incubated with increasing amounts (1:1, 1:2, 1:4, 1:8) of
JAM-A up to 40 μM. The mixture of eleven distinct deglycosylated humanized IgG
antibodies included two marketed therapeutic mAbs (rituximab and trastuzumab) and nine
point mutation variants of the Hz6F4-2 mAb [4, 5]. They were mixed together prior to
(+2,634 Da). For each set of pe
Relative ratios of each detected
served to estimate the mean DA
chromatography data (data not
PNGase-F deglycosylation. Finally, all the samples were buffer exchanged against 150
mM ammonium acetate (AcONH4) pH 7.5. trastuzumab, deglycosylated brentuximab
vedotin, and the mAb/antigen complexes of J10.4 mAb/JAM-A were injected at 5 μM, and
the deglycosylated IgG mixture was injected at 1 μM on the Exactive Plus EMR Orbitrap
mass spectrometer.


