5
Thermo Scientific Poster Note
•
PN-64091-ASMS-EN-0614S
Orbitrap Native MS Analysis of Immune mAb/Antigen Complexes
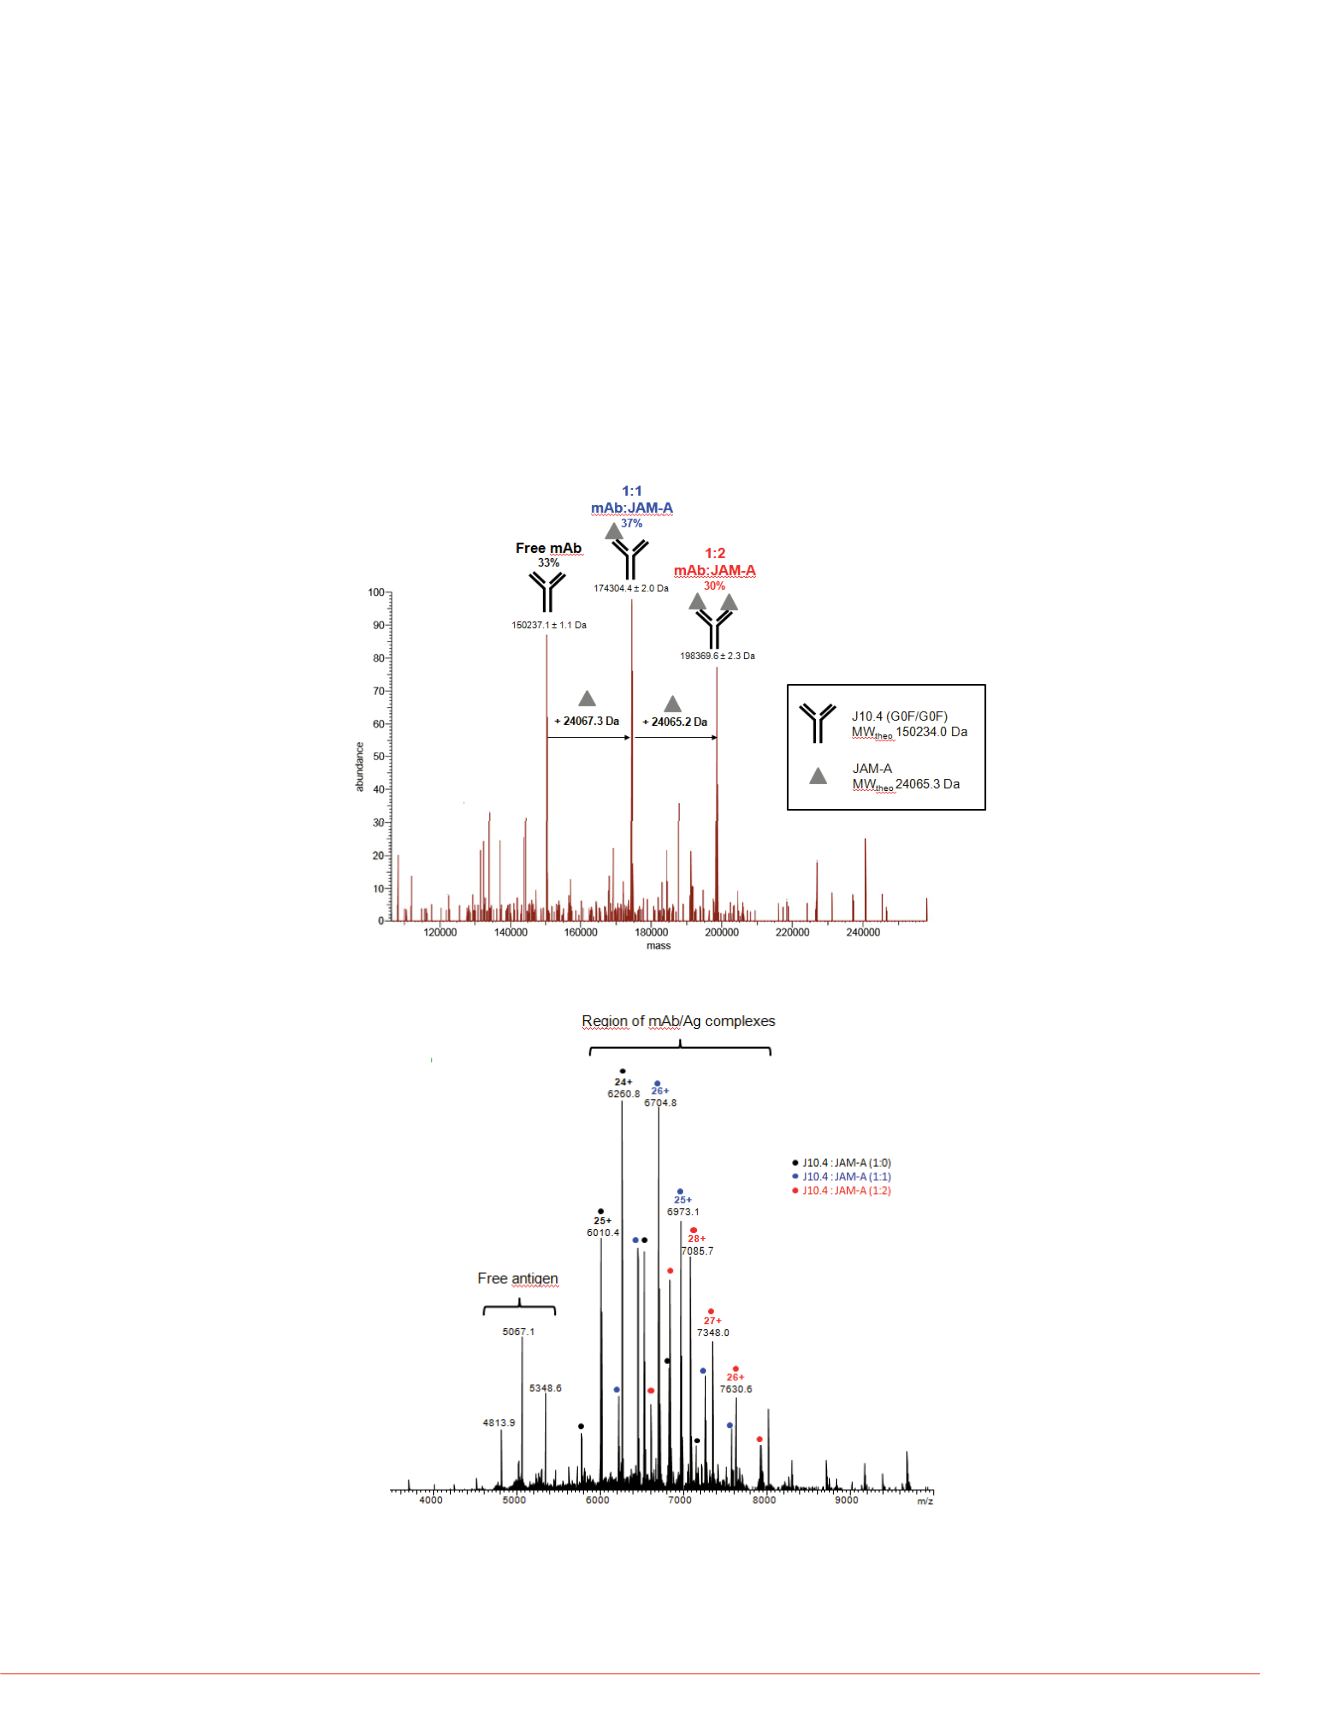
The native mass spectrum of mAb/antigen complexes was recorded at a resolution of
35,000 with the in-source CID voltage set to 150 eV. As shown in Figure 4A, when an
4-fold excess of JAM-A (20 μM) is added to J10.4 mAb (5 μM), three species are
noclonal antibody trastuzumab.
ss spectrum and zoom of
pectrum showing molecular
m mass accuracy.
Native MS Analysis of a Mixture
Figure 5 presents a deconvoluted
deglycosylated humanized IgG anti
resolution of 140,000 and accurate
detected: the intact free mAb (MW 150237.1 ± 1.1 Da, black), 1:1 (MW 174304.4 ±
2.0 Da, blue) and 1:2 (MW 198369.6 ± 2.3Da, red) mAb:JAM-A complexes. Native MS
thus confirmed that two JAM-A molecules can bind to J10.4 mAb. MWs correspond to
the main G0F/G0F glycoforms. Relative abundances were estimated from MS peak
intensities and proportions of mAb:Ag complexes at 1:1 and 1:2 stoichiometries were
b d t b 37% d 30% ti l
hil f
Ab
t 33% Fi
4B
of ten out of the eleven compound
due to very close molecular weight
2v3, which differ by only 21 Da in
However, they are not baseline res
(S/N) ratio (S/N < 20), that causes
d i
l t
i
ti (S/N
o serve o e
an
, respec ve y, w e ree m represen s
. gure
shows the corresponding mass spectrum with the entire charge state distribution in
native conditions.
a goo s gna - o-no se ra o
>
peaks of Hz6F4-2v9 and 6F4-2v10
for both species (see Table 1).
Figure 5. Deconvoluted mass sp
of eleven N-deglycosylated hum
Figure 4. Orbitrap native MS detection of immune mAb/antigen complexes.
A Deconvoluted mass spectrum showing mAb/antigen binding stoichiometries
.
.
B. Charge state distribution in native conditions.
A
TABLE 1 Measured and theoret
.
deglycosylated humanized anti
Species
Theor
R
Rituximab
10
6F4-2 v10
9
6F4-2 v9
4
6F4-2 v 4
3
6F4-2 v3
6F4
6F4-2
7
6F4-2 v7
5
6F4-2 v5
lonal Antibody-Drug-Conjugate
wing the determination of drug-
h the entire charge state
Conclusion
6
= 3.8
DAR
=
8
8
0
n
DAR
A
nA
DAR
=
4.2
1
6F4-2 v1
6
6F4-2 v6
T
Trastuzumab
The Orbitrap mass analyzer
as the interference peaks, e
The Exactive Plus EMR MS
mass differences between
.7 Da
0
n
DAR
B
payloads/drugs. For each s
determined as well as the r
the mean DAR value.
Native Orbitrap MS can rev
abundances of mAb/Ag co
DAR8
2635.1 Da
156432.6 ± 1.8 Da
DAR8
MS peak intensities.
The Exactive Plus EMR MS
ensuring excellent mass ac
Mass (Da)
00
158000
156000
R fe erences
1. Heck, A. J. Nat. Methods 2
2. Beck, A. et al., TrAC 2013,
3. Beck, A. et al., Anal. Chem.
4. Atmanene, C. et al., Anal C
Herceptin is a trademark of Roche. Adcetris i
Biosystems. All other trademarks are the pr
is not intended to encourage use of these pr
of others.
5. Debaene, F. et al., Anal Ch


