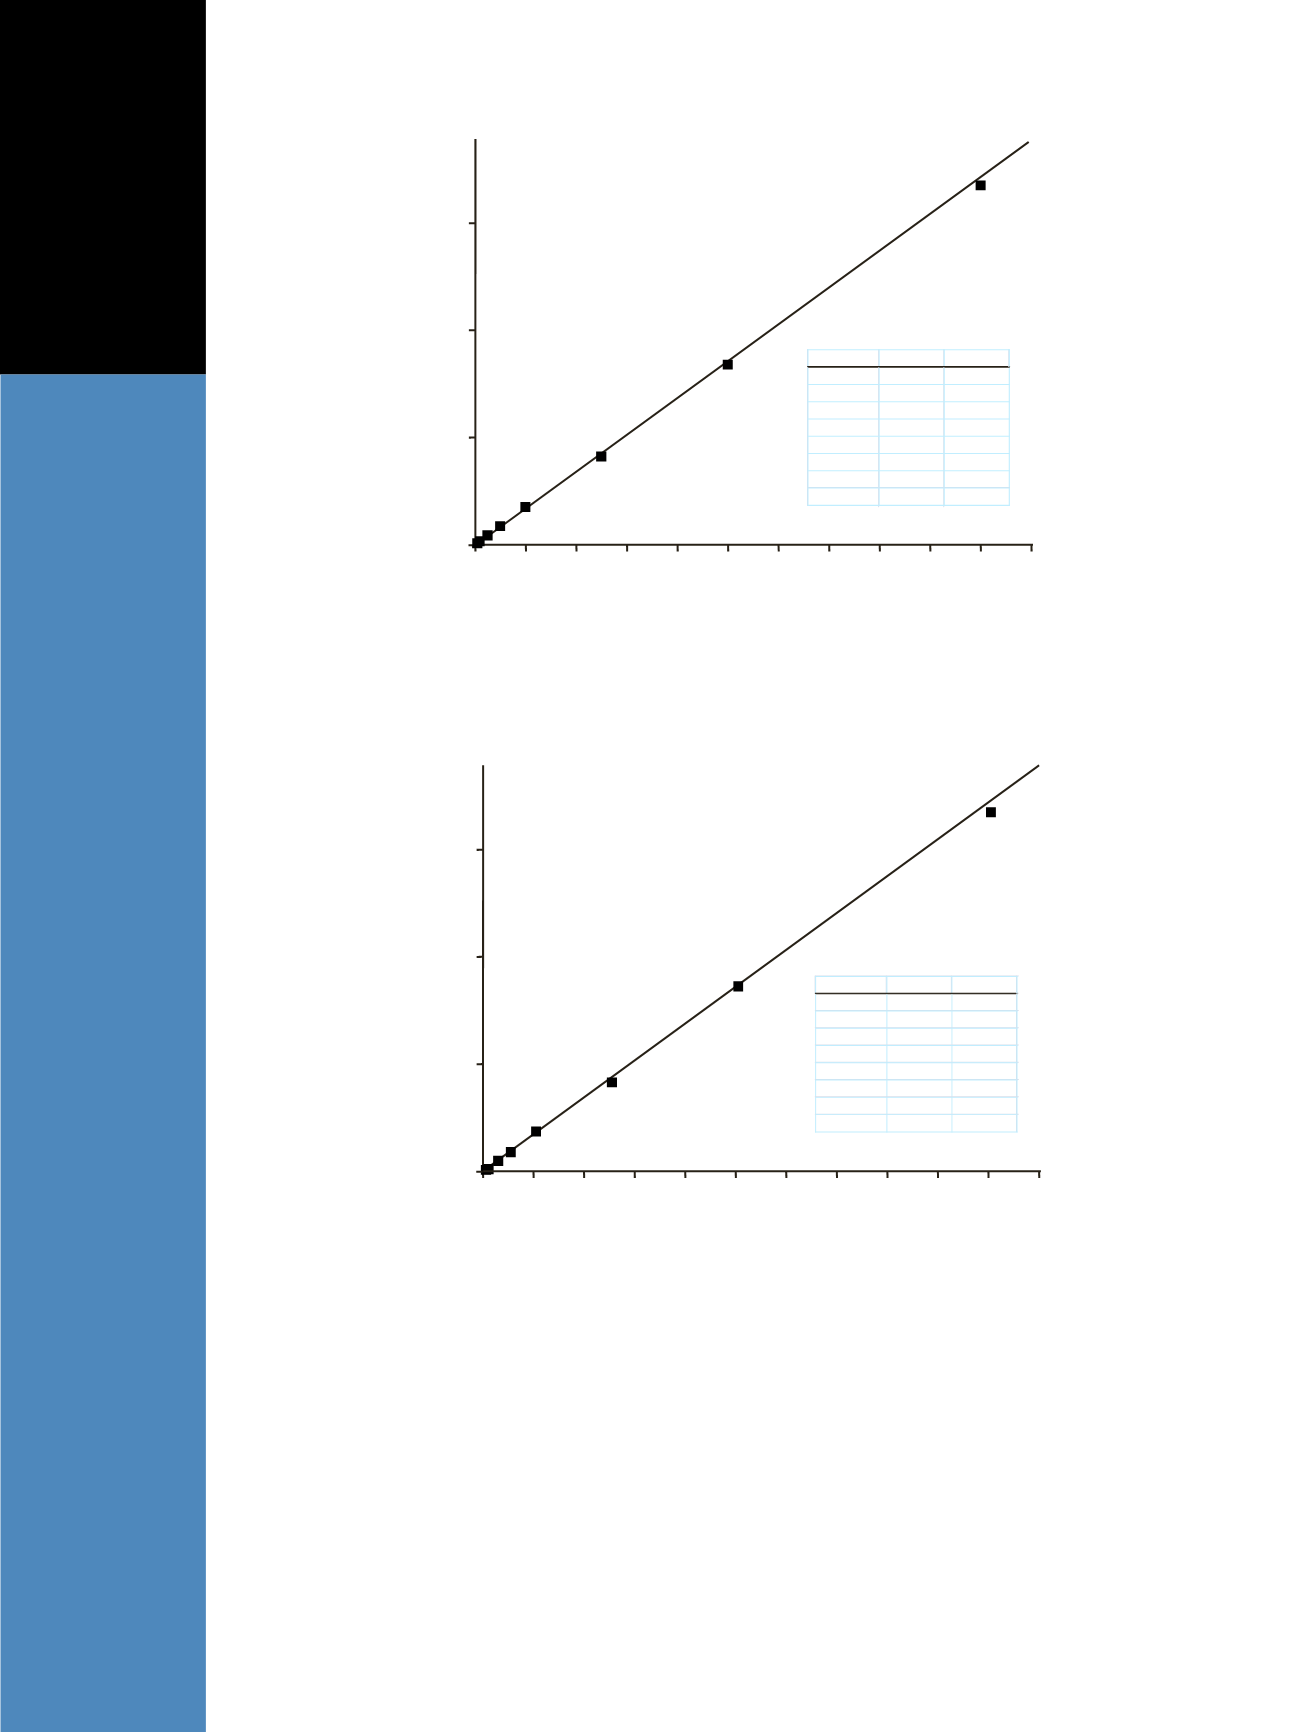

3. Determination of LLOQ, Linearity and Accuracy
CSS was first evaluated by comparing it to human
plasma to determine if it was suitable. During this stage
of the validation, CSS samples with progressively lower
concentrations of E1 and E2 were prepared in triplicate
along with one set of CSS calibrators.
The method was linear between 3.5 and 1019.3 pg/mL
with accuracy (n=3) from 85.8% to 107.0% for E1, and
between 4.4 and 1032.5 pg/mL with accuracy (n=3) from
92.9% to 112.8% for E2 (Table 1 and Figure 3). The
LLOQ for E1 and E2 are 3.5 and 4.4 pg/mL, respectively
(Table 1 and Figure 4).
Calibrator pg/mL Dif (%)
Cal2
5.00
3.08
Cal3
10.00
-7.15
Cal4
25
1.95
Cal5
50
-1.25
Cal6
100
5.04
Cal7
250
-1.14
Cal8
500
1.52
Cal9
1000
-2.04
0
200
400
600
800
1000
0
Concentration (pg/mL)
E2
Y = 0.00301088+0.0034382X
R
2
= 0.9981 W: 1/X
2
1
2
3
Area Ratio
Figure 2. Calibration curve of E2 in CSS
0
200
400
600
800
1000
0
Concentration (pg/mL)
E1
Y=0.00666948+0.00858398X
R
2
= 0.9988 W: 1/X
2
2.5
5.0
7.5
Calibrator pg/mL Dif (%)
Cal2
5.00
-1.43
Cal3
10.00
0.52
Cal4
25
4.97
Cal5
50
1.37
Cal6
100
3.12
Cal7
250
-3.93
Cal8
500
-2.13
Cal9
1000
-2.48
Area Ratio
Figure 1: Calibration curve of E1 in CSS


