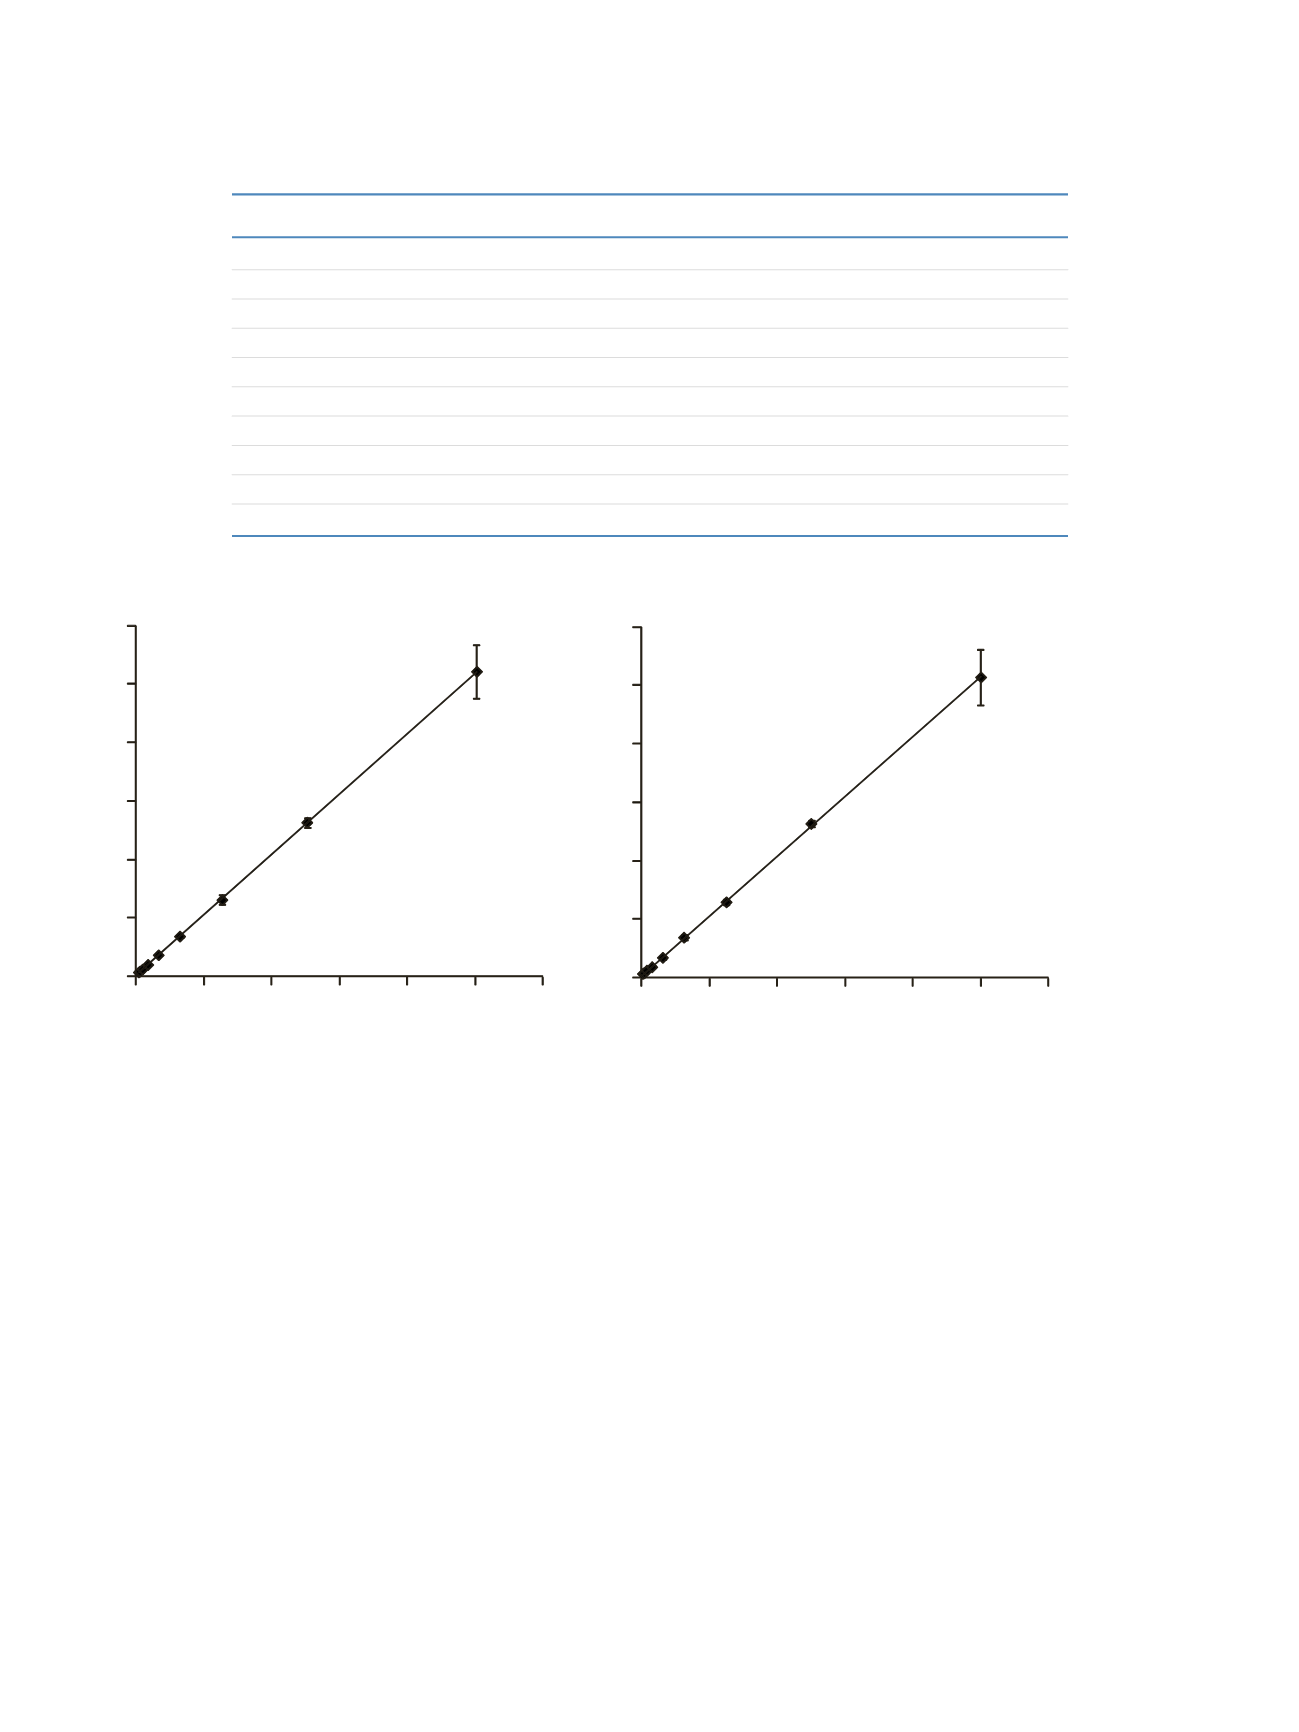

Table 1. LLOQ, dynamic range and accuracy
E1
E2
Dilution
Expected
Measured
CV of
Accuracy
Measured
CV of
Accuracy
factor
(pg/mL)
(mean, pg/mL)
Triplicates (%)
(%)
(mean, pg/mL)
Triplicates (%)
(%)
256
3.91
3.5
18.8
90.5
4.4
7.1
112.8
128
7.81
8.4
4.5
107.0
8.0
9.0
102.2
64
15.63
15.8
9.4
101.2
18.0
5.1
115.2
32
31.25
28.7
0.6
92.0
31.0
8.8
99.1
16
62.50
56.7
4.8
90.7
60.8
6.7
97.2
8
125.00
107.2
3.9
85.8
116.1
6.8
92.9
4
250.00
224.2
7.4
89.7
242.2
4.4
96.9
2
500.00
484.2
3.5
96.8
492.2
2.4
98.4
1
1000.00
1019.3
8.9
101.9
1032.5
9.1
103.2
Mean
95.1
102.0
0
200
400
600
800
1000
1200
0
200 400 600 800 1000 1200
Estrone (E1)
Expected concentration (pg/mL)
Measured concentration (pg/mL)
0
200
400
600
800
1000
1200
0
200 400 600 800 1000 1200
Expected concentration (pg/mL)
Estradiol (E2)
Slope = 1.02
Correlation = 0.998
Slope = 1.02
Correlation = 0.998
Figure 3: Linearity (Deming regression)


