
Part of Thermo Fisher Scientific
www.thermoscientific.comLegal Notices: ©2011 Thermo Fisher Scientific Inc. All rights reserved. All other trademarks are the property of Thermo Fisher Scientific and its subsidiaries. This
information is presented as an example of the capabilities of Thermo Fisher Scientific Inc. products. It is not intended to encourage use of these products in any
manners that might infringe the intellectual property rights of others. Specifications, terms and pricing are subject to change. Not all products are available in all
countries. Please consult your local sales representative for details.
Thermo Fisher Scientific,
San Jose, CA USA is ISO Certified.
AN63439_E 06/11S
In addition to these
offices, Thermo Fisher
Scientific maintains
a network of represen
tative organizations
throughout the world.
Africa-Other
+27 11 570 1840
Australia
+61 3 9757 4300
Austria
+43 1 333 50 34 0
Belgium
+32 53 73 42 41
Canada
+1 800 530 8447
China
+86 10 8419 3588
Denmark
+45 70 23 62 60
Europe-Other
+43 1 333 50 34 0
Finland/Norway/
Sweden
+46 8 556 468 00
France
+33 1 60 92 48 00
Germany
+49 6103 408 1014
India
+91 22 6742 9434
Italy
+39 02 950 591
Japan
+81 45 453 9100
Latin America
+1 561 688 8700
Middle East
+43 1 333 50 34 0
Netherlands
+31 76 579 55 55
New Zealand
+64 9 980 6700
Russia/CIS
+43 1 333 50 34 0
South Africa
+27 11 570 1840
Spain
+34 914 845 965
Switzerland
+41 61 716 77 00
UK
+44 1442 233555
USA
+1 800 532 4752
Conclusion
We have developed and fully validated a simple, fast and
sensitive LC-APCI-MS/MS method for measurement of
E1 and E2 in serum/plasma without derivatization. The
LLOQ for E1 and E2 are 3.5 and 4.4 pg/mL, respectively.
The method was linear between 3.5 and 1019.3 pg/mL for
E1, and 4.4 and 1032.5 pg/mL for E2. No ion suppression
or carryover was observed. In addition, for clinical
research laboratories, this method offers high precision
and recovery.
For Research Use Only. Not for use in diagnostic procedures.
Retention Time (min)
2.1
2.4
2.7
3.0
3.3
3.6
3.9
0
379
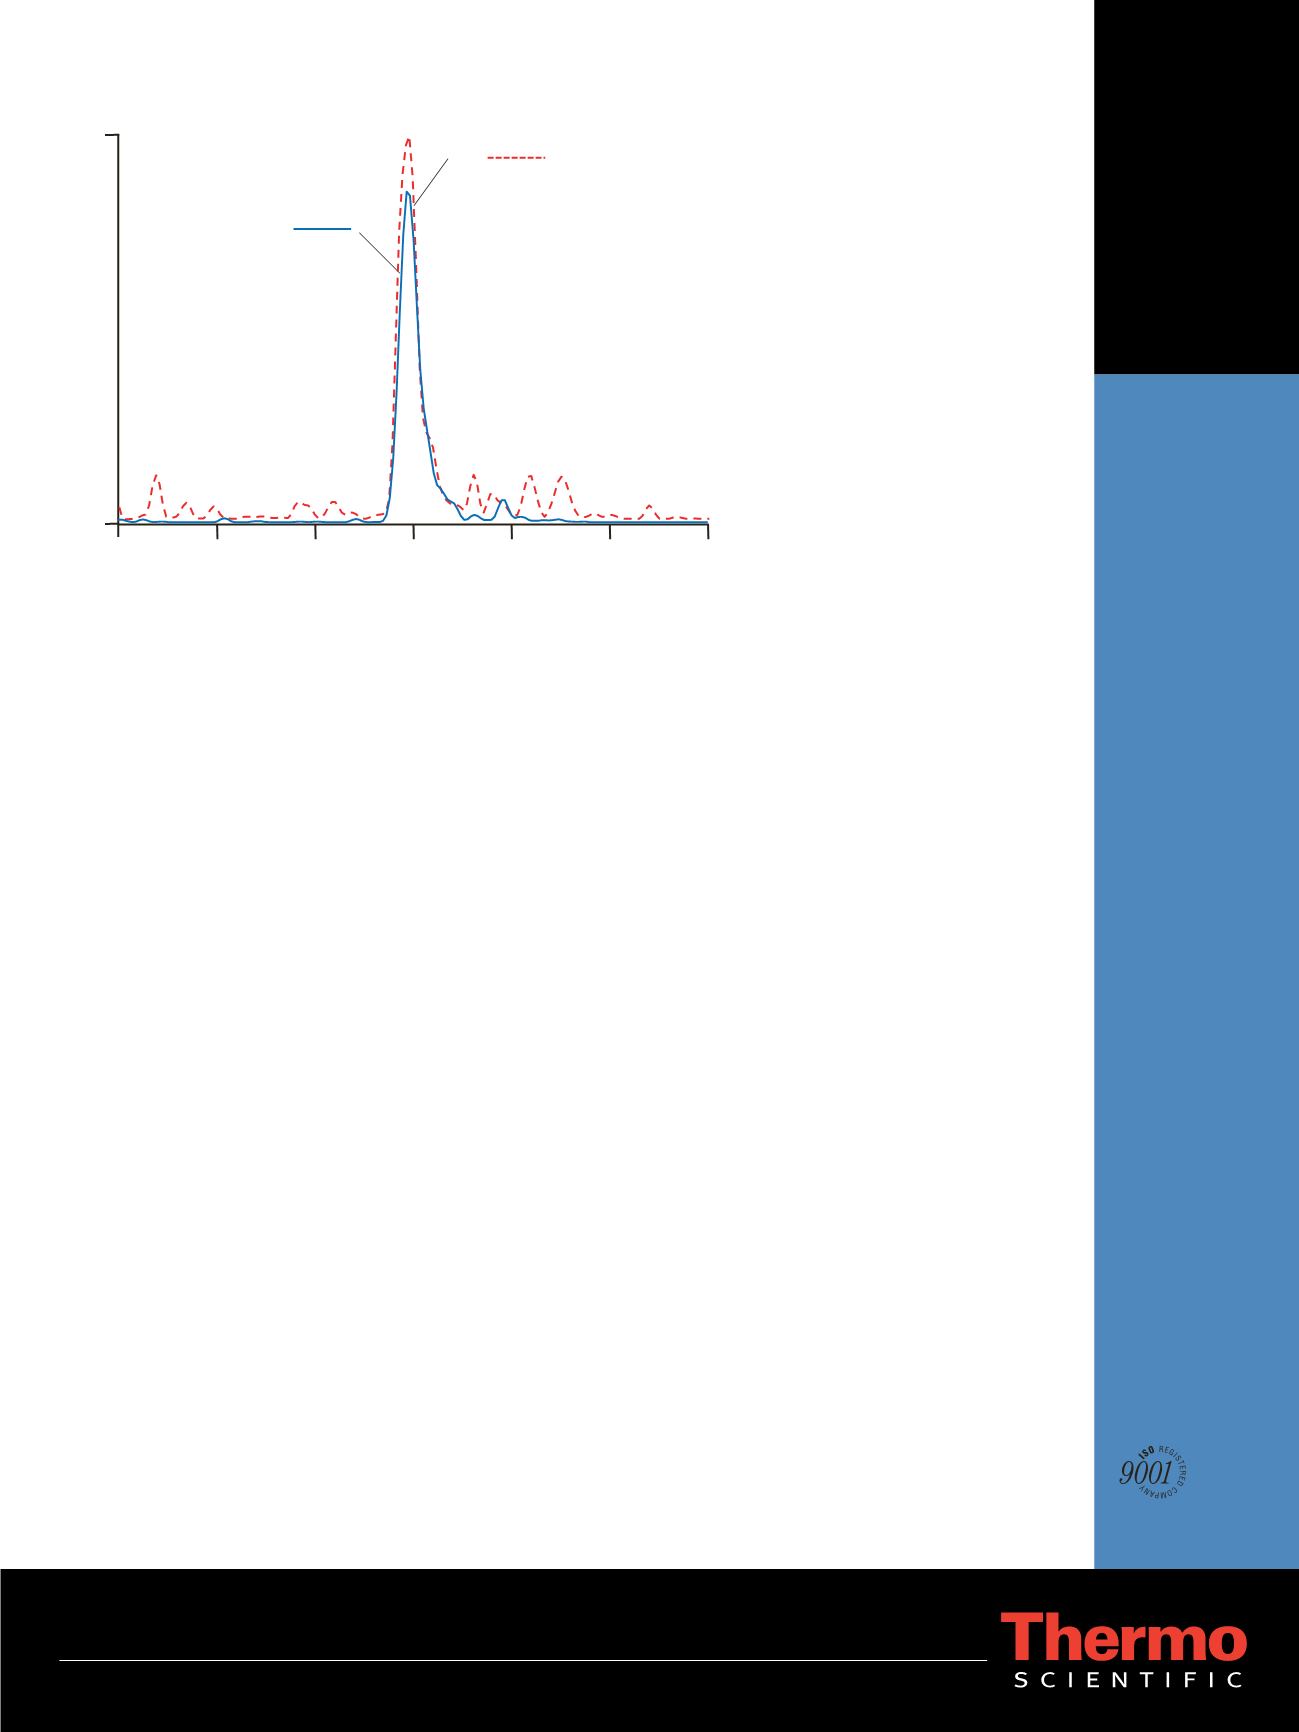
E1:
269 145
16.9 pg/mL
E2:
271 183
25.1 pg/mL
Intensity
SRM:
SRM:
Figure 7: SRM chromatograms of E1 and E2 in human plasma sample 2 (female)


