
6. Carryover
No carryover was observed in the solvent blank injection
that was right after a processed spiked CSS sample with E1
and E2 concentration at 300 pg/mL.
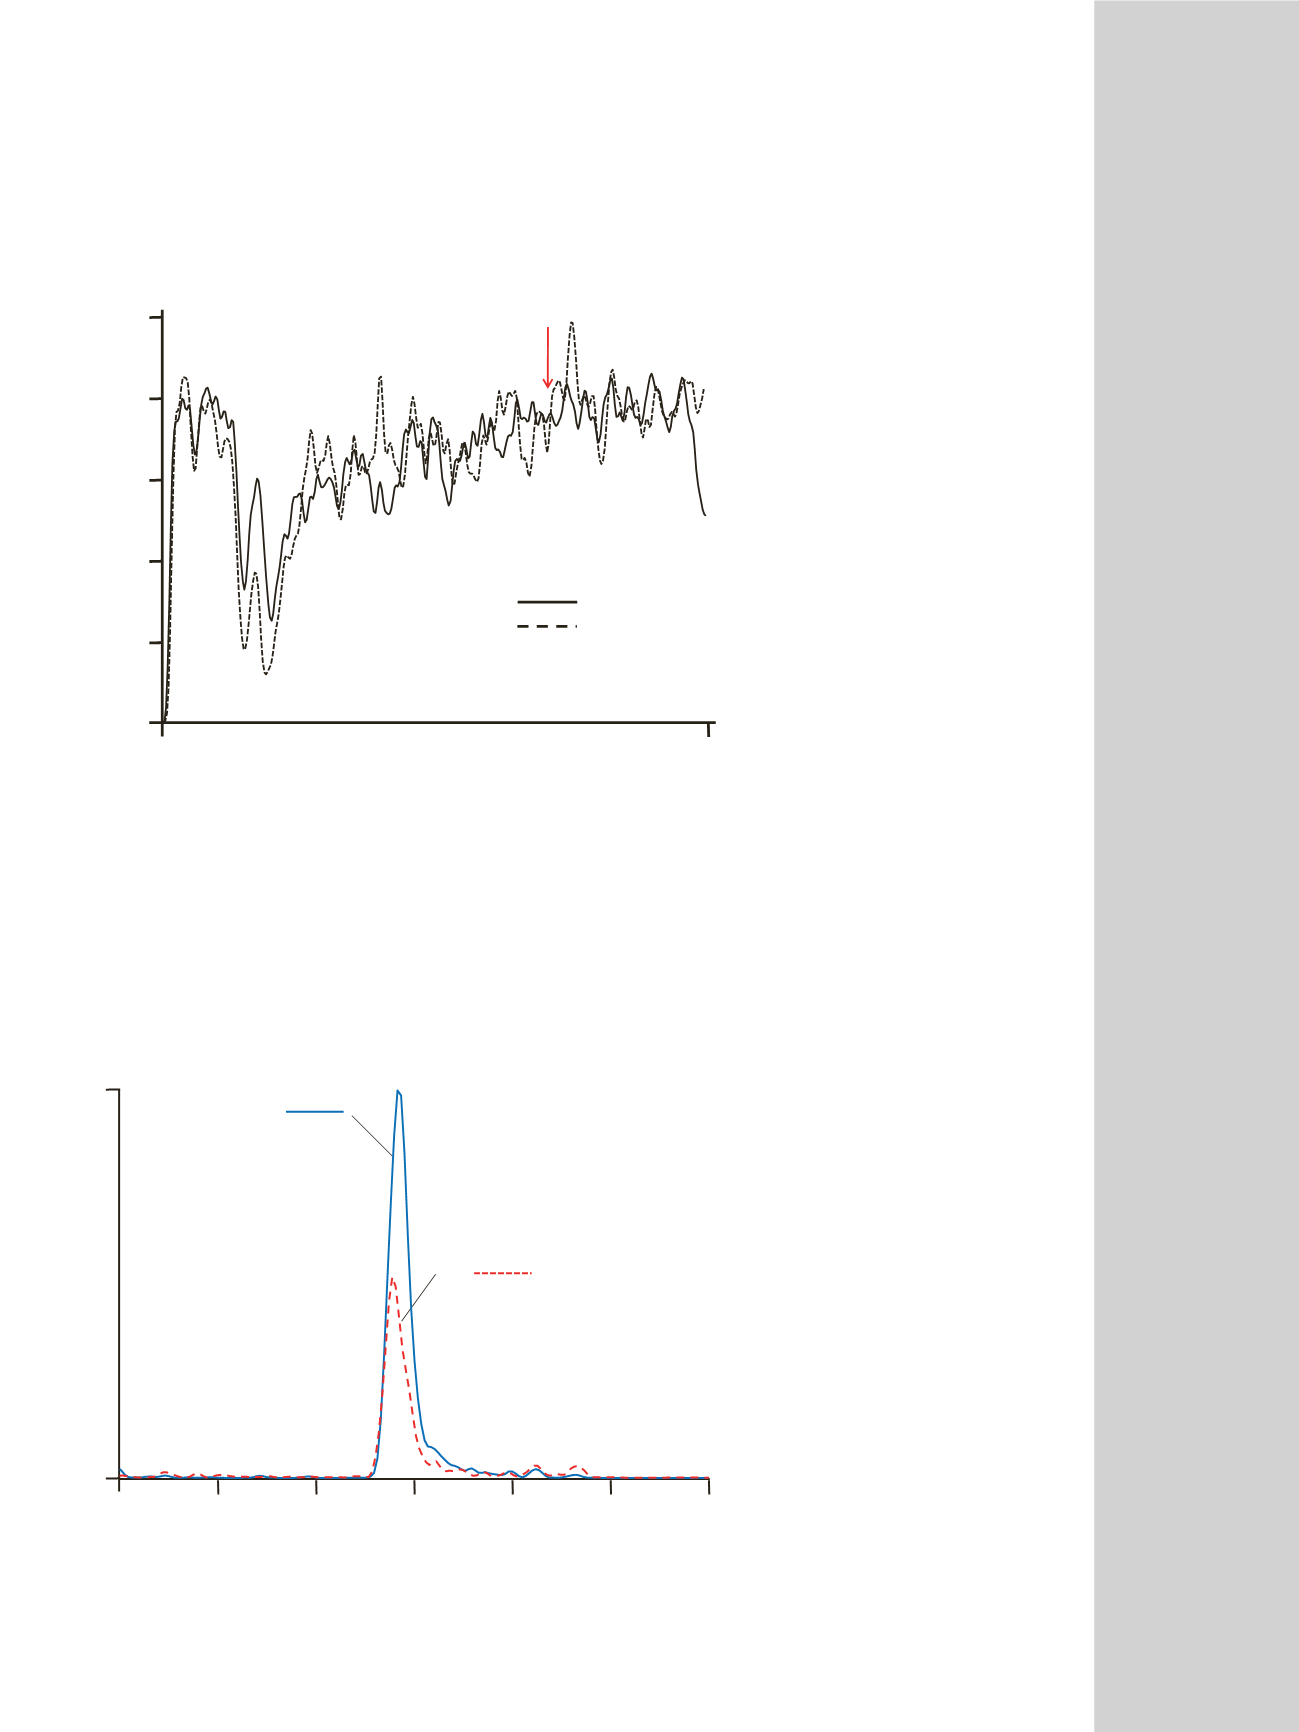
Figures 6 and 7 show the SRM chromatograms of E1 and
E2 in two individual plasma samples.
5. Ion Suppression
Results from the post-column infusion experiments are
shown in Figure 5. Compared to solvent blank (60%
methanol), no obvious ion suppression was detected in
the SRM chromatograph of IS using a processed human
plasma sample without IS. The red arrow indicates where
E1 and E2 elute during the LC gradient.
0.5
6250
5000
3750
2500
1250
0
Retention Time (min)
Blank solvent
Plasma
4.0
Intensity
Retention Time (min)
2.1
2.4
2.7
3.0
3.3
3.6
3.9
0
335
E1:
269 145
19.8 pg/mL
E2:
271 183
5.3 pg/mL
Intensity
SRM:
SRM:
Figure 5: Ion suppression test
Figure 6: SRM chromatograms of E1 and E2 in human plasma sample 1 (male)


