
Part of Thermo Fisher Scientific
www.thermoscientific.comLegal Notices: ©2011 Thermo Fisher Scientific Inc. All rights reserved. ImmunoTube is a registered trademark of Immundiagnostik AG. All other trademarks are
the property of Thermo Fisher Scientific Inc. and its subsidiaries. This information is presented as an example of the capabilities of Thermo Fisher Scientific Inc.
products. It is not intended to encourage use of these products in any manners that might infringe the intellectual property rights of others. Specifications, terms and
pricing are subject to change. Not all products are available in all countries. Please consult your local sales representative for details.
Thermo Fisher Scientific,
San Jose, CA USA is ISO Certified.
AN63399_E 04/11S
In addition to these
offices, Thermo Fisher
Scientific maintains
a network of represen
tative organizations
throughout the world.
Africa-Other
+27 11 570 1840
Australia
+61 3 9757 4300
Austria
+43 1 333 50 34 0
Belgium
+32 53 73 42 41
Canada
+1 800 530 8447
China
+86 10 8419 3588
Denmark
+45 70 23 62 60
Europe-Other
+43 1 333 50 34 0
Finland/Norway/
Sweden
+46 8 556 468 00
France
+33 1 60 92 48 00
Germany
+49 6103 408 1014
India
+91 22 6742 9434
Italy
+39 02 950 591
Japan
+81 45 453 9100
Latin America
+1 561 688 8700
Middle East
+43 1 333 50 34 0
Netherlands
+31 76 579 55 55
New Zealand
+64 9 980 6700
Russia/CIS
+43 1 333 50 34 0
South Africa
+27 11 570 1840
Spain
+34 914 845 965
Switzerland
+41 61 716 77 00
UK
+44 1442 233555
USA
+1 800 532 4752
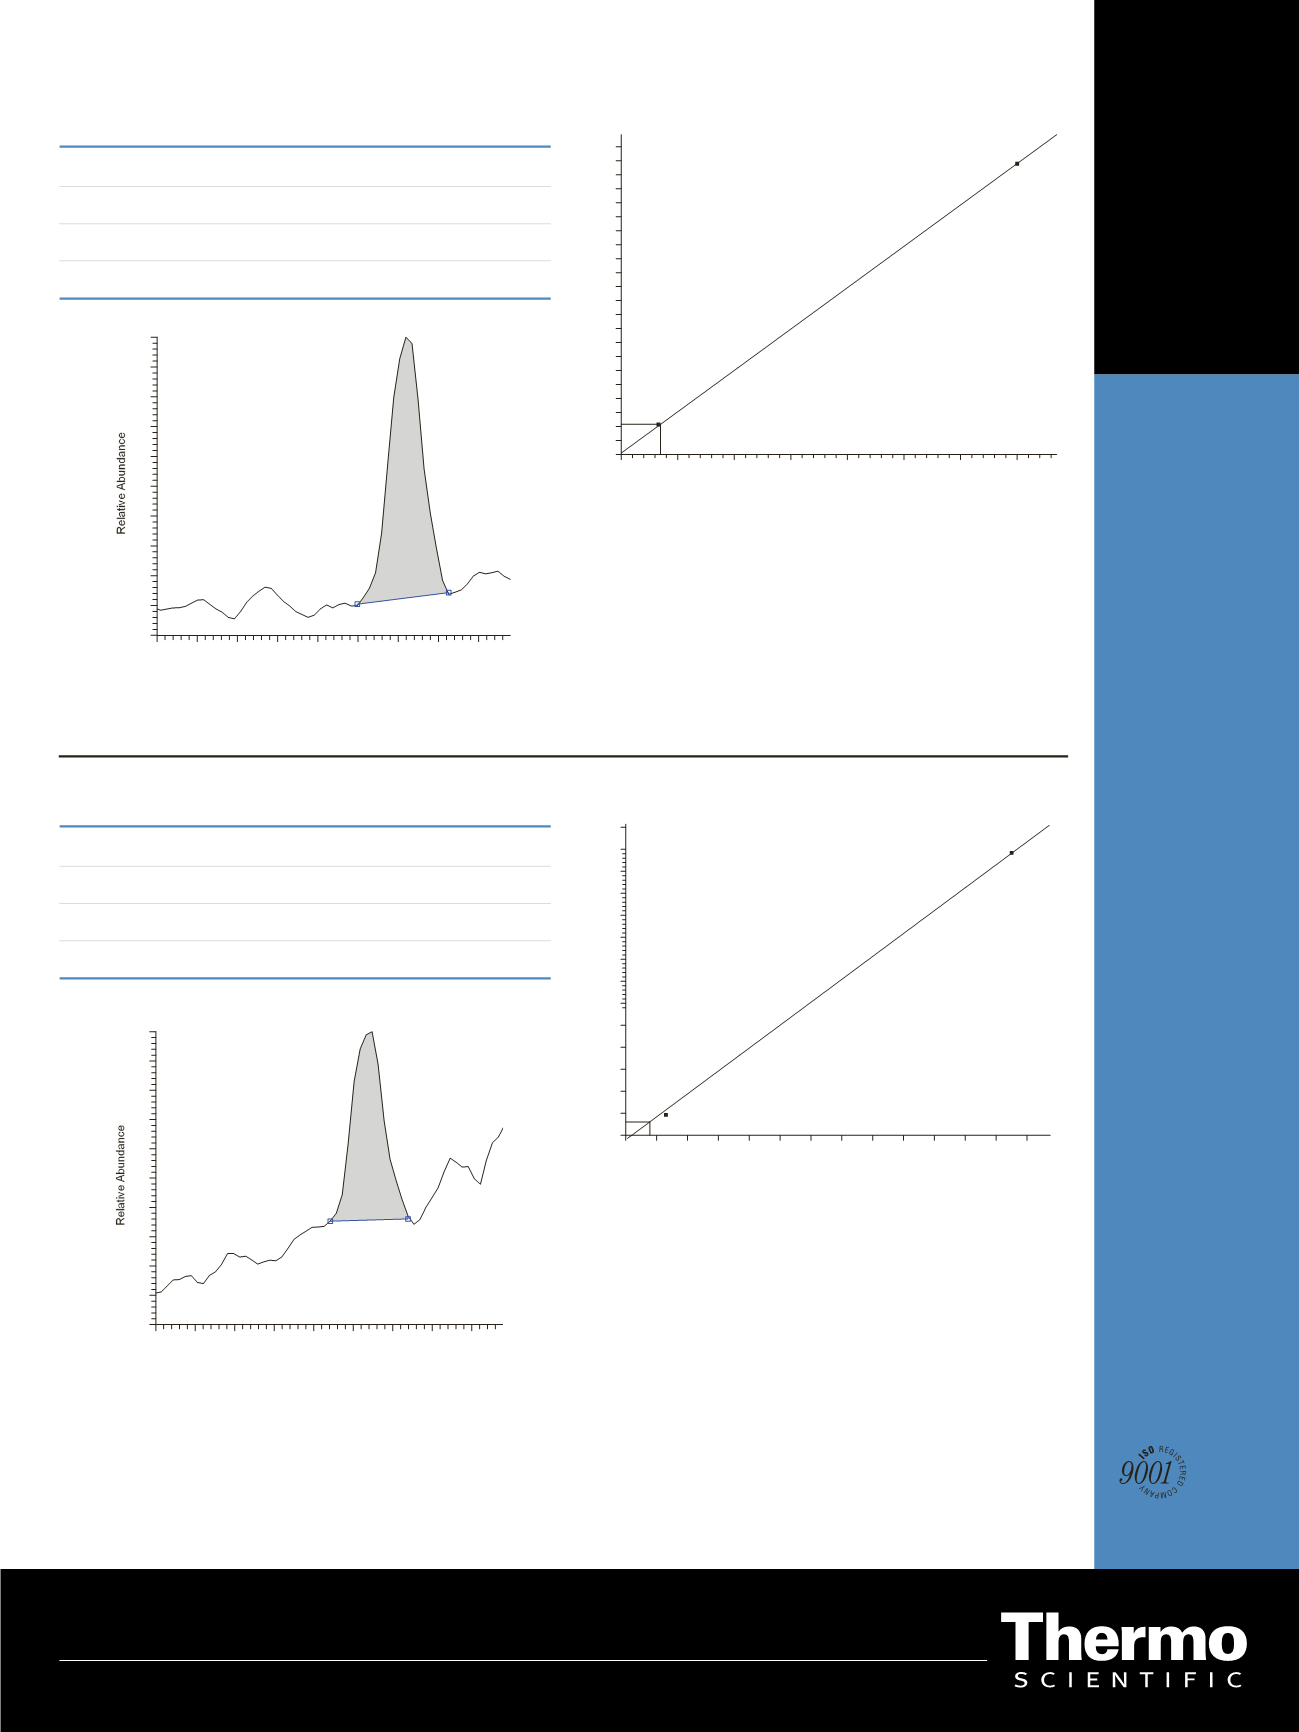
Figure 1: Data for 1,25D
2
(Transition 411
→
151)
D2 151
Y=0.0475068+0.0295773*X R^2=0.9999 W:Equal
0
50
100
150
200
250
300
350
0.0
0.5
1.0
1.5
2.0
2.5
3.0
3.5
4.0
4.5
5.0
5.5
6.0
6.5
7.0
7.5
8.0
8.5
9.0
9.5
10.0
10.5
11.0
AreaRatio
Concentration (pg/mL)
1,25D
2
Measured (pg/mL)
Specified (pg/mL)
Cal1
34.8
33
Cal2
349.8
350
Ctrl1
94.3
63-105
Ctrl2
311.6
203-348
1.0 1.1 1.2 1.3 1.4 1.5 1.6 1.7 1.8
0
10
20
30
40
50
60
70
80
90
100
SN: 108
RMS
Retention Time (min)
1,25D
3
Measured (pg/mL)
Specified (pg/mL)
Cal1
21.7
26
Cal2
250.4
250
Ctrl1
59.9
49-81
Ctrl2
200.8
146-244
Cal1
D3 151
Y= -0.0997963+0.0260387*X R^2=0.9991 W:Equal
0
20
40
60
80 100 120 140 160 180 200 220 240 260
0.0
0.5
1.0
1.5
2.0
2.5
3.0
3.5
4.0
4.5
5.0
5.5
6.0
6.5
7.0
AreaRatio
Concentration (pg/mL)
Calibration Curve (Cal1, Cal2)
1.0 1.1 1.2 1.3 1.4 1.5 1.6 1.7 1.8
0
10
20
30
40
50
60
70
80
90
100
SN: 62
RMS
Retention Time (min)
Cal1
Figure 2: Data for 1,25D
3
(Transition 399
→
151)
Calibration Curve (Cal1, Cal2)


