
Quantitative LC-MS/MS Analysis of
25-OH Vitamin D
3
/D
2
Comparing 1D
Chromatography, 2D Chromatography and
Automated Online Sample Preparation
Neil Leaver
1
, Bevean Chihoho
1
, Sarah Robinson
2
;
1
Royal Brompton & Harefield NHS Foundation Trust, Harefield Hospital,
Harefield, UK;
2
Thermo Fisher Scientific, Hemel Hempstead, UK
For Research Use Only. Not for use in diagnostic procedures.
Application
Note:
Key Words
Ultra
Introduction
High performance liquid chromatography – tandem mass
spectrometry (HPLC-MS/MS) is now widely accepted for
measurement of vitamin D metabolites. Many clinical
research laboratories use 1-dimensional (1D) chromatogra-
phy (for example, a single HPLC pump and chromatogra-
phy column) with a triple stage quadrupole mass spec-
trometer. Various sample cleanup protocols, such as solid
phase extraction (SPE), liquid-liquid extraction (LLE), and
protein precipitation (PPT), have been applied in these
analyses. Frequently, interfering peaks are seen in 25-OH
vitamin D3 chromatograms, adversely affecting peak inte-
gration and leading to poor accuracy and reproducibility.
Here we investigate the use of 2-dimensional chromatogra-
phy using TurboFlow technology to remove all interfering
peaks and significantly improve data quality.
Goal
Compare three methods for the quantitative analysis of
25-OH vitamin D
3
/D
2
: a validated, online TurboFlow™
method; a commercially available 2D-SPE-LC-MS/MS
kit method (Chromsystems MassChrom
®
25-OH
Vitamin D
3
/D
2
); and a 1D chromatography method.
Experimental Conditions
A 100 µL sample of plasma was mixed with 200 µL inter-
nal standard (IS) in acetonitrile, vortexed, and centrifuged.
For analysis, 50 µL of supernatant was injected onto the
column. Details of the commercial calibrator and QC
values (Chromsystems) used in each assay are provided in
Tables 1 and 2. (Please note that the control product has
since been reformulated to validate borderline D
3
insuf-
ficiency and normal levels.) These commercial products
were validated against in-house calibration and control
material over a wider dynamic range.
HPLC analysis was performed using the Thermo Scien-
tific Transcend TLX-1 system powered by TurboFlow™
technology. For analysis, a TurboFlow XL C18 extraction
column (50 x 0.5 mm) and a Thermo Scientific Hypersil
GOLD analytical column (50 x 2.1 mm, 1.9 µm) were
used. For 1D analysis, the analytical column alone was
used. For the commercial 2D set up, columns provided
within the 2D-SPE-LC-MS/MS kit were used. Eluents for
the TurboFlow method were 0.1% formic acid, methanol
+ 0.1% formic acid, and acetonitrile/IPA/acetone blend
(wash solution).
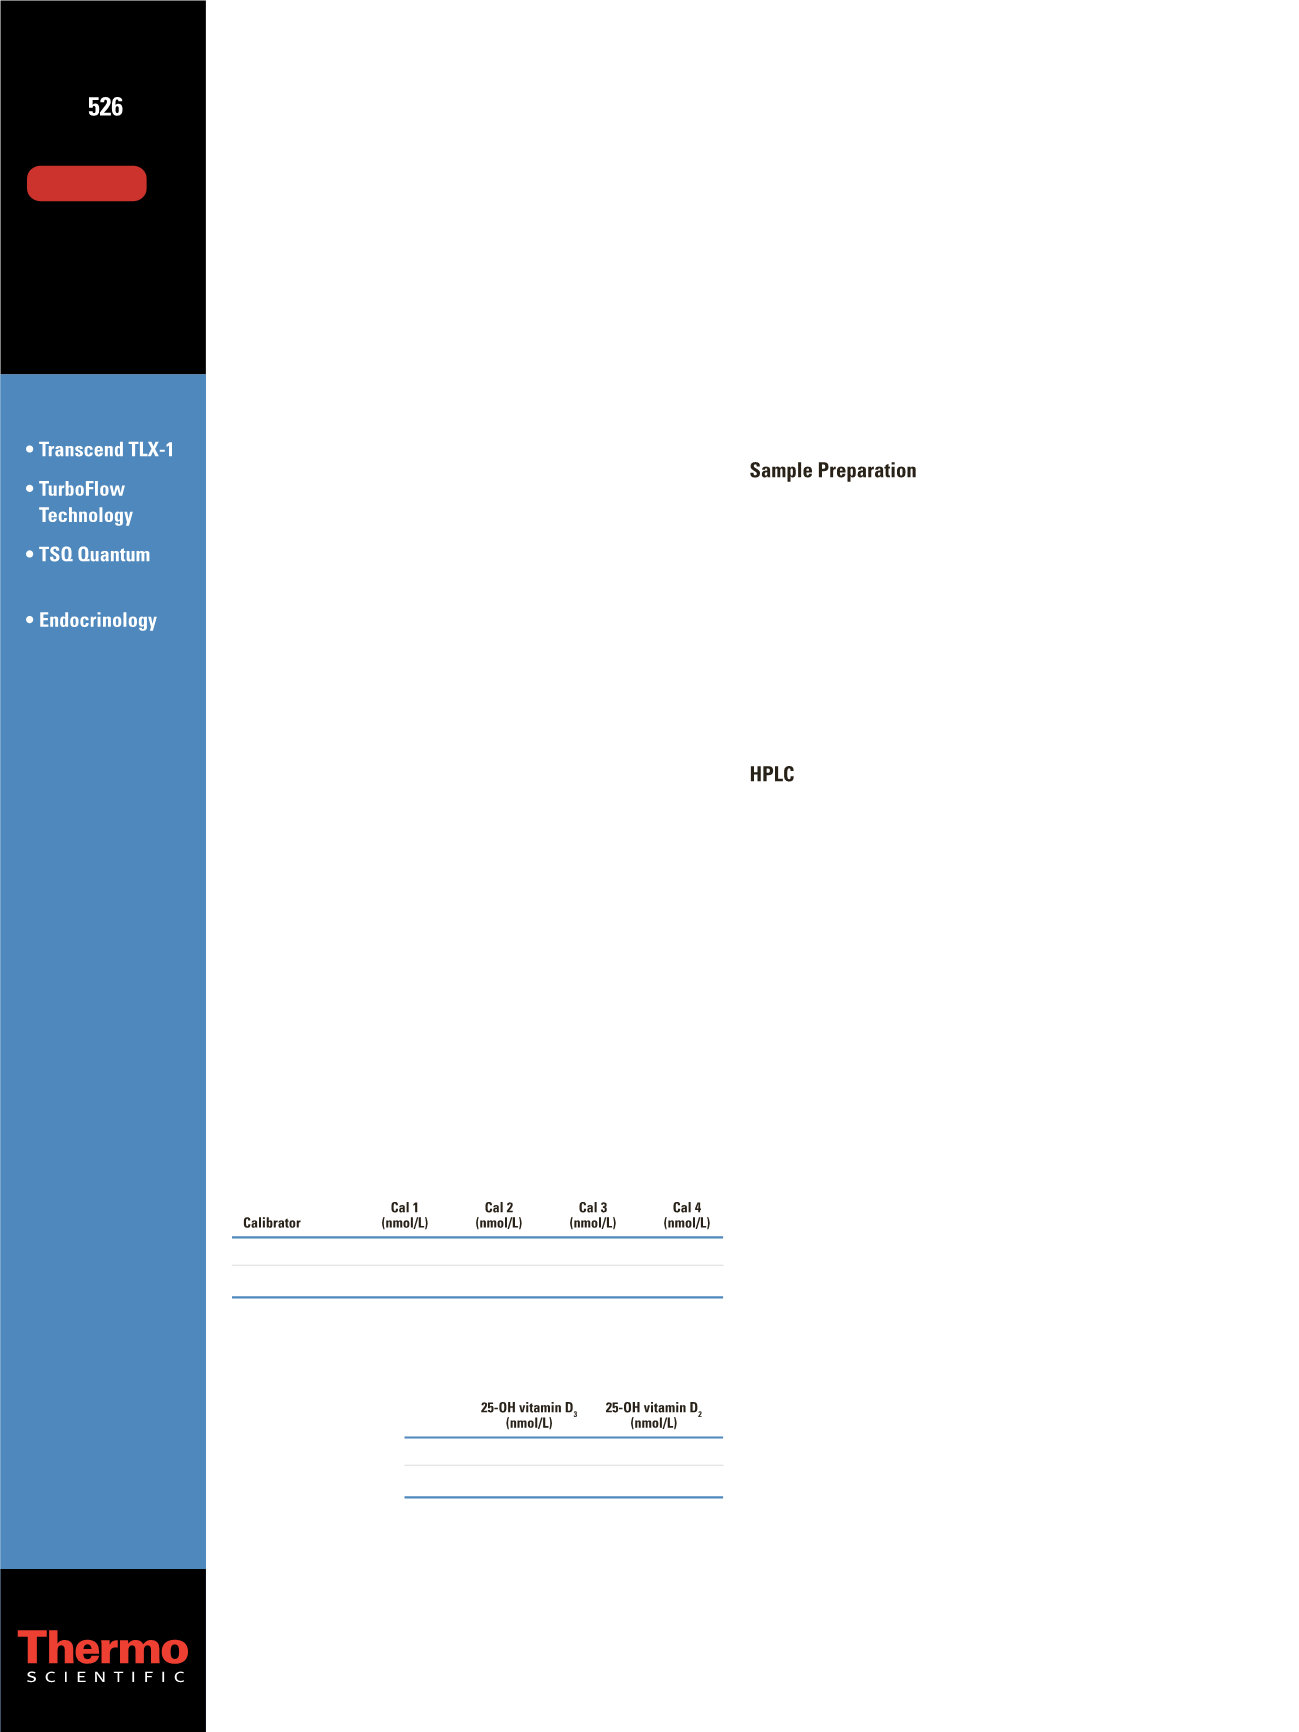
Table 1. Calibrator levels.
25-OH Vitamin D
3
9.9
47.8
86.2
174.0
25-OH Vitamin D
2
0.0
37.5
72.3
146.0
Table 2. Quality control levels.
Mean
Mean
QC1
77.1
72.7
QC2
167
150
DOWNLOAD


