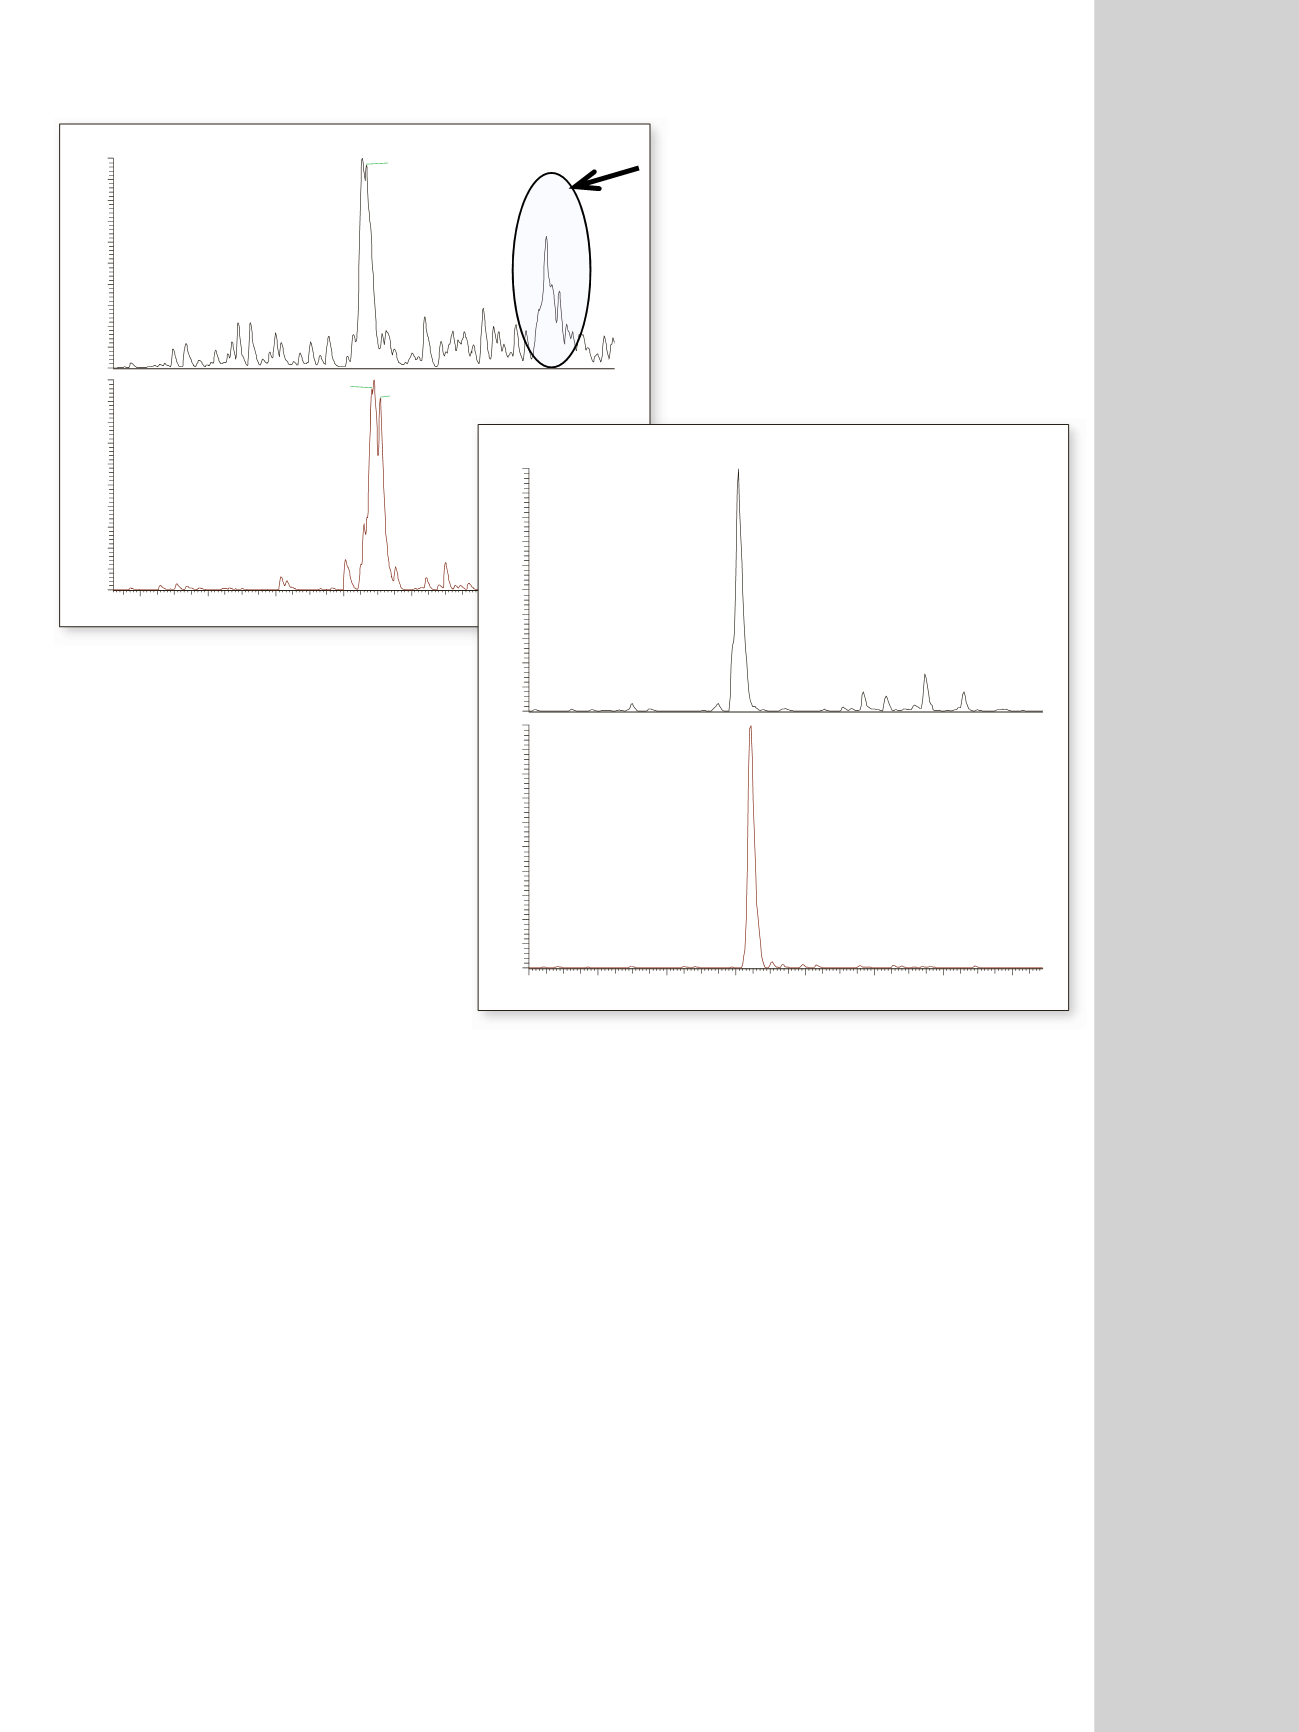

Figure 3. (A) 2D SPE LC-MS/MS of 10 nmol/L matrix
standard (recommended kit SRM transition used) and
(B) TurboFlow method of 10 nmol/L matrix standard.
1.6
1.8
2.0
2.2
2.4
2.6
2.8
3.
Time (min)
0
10
20
30
40
50
60
70
80
90
100
0
10
20
30
40
50
60
70
80
90
100
Relative Abundance
2.25
2.27
2.80
2.29
2.28
2.31
25-OH-D
3
25-OH-D
2
Although cleanup is improved when using other 2D
LC-MS/MS methods, interferences are still observed in the
25-OH-D
3
XIC (Figure 3A). Furthermore, at the bottom
of the range for 25-OH-D
3
(~10 nmol/L), is detected with
greater analytical sensitivity and less noise when analyzed
using the TurboFlow method versus a 2D SPE cleanup
procedure (Figure 3B).
The 2D-LC-MS/MS approach reduces SRM
interferences in the 25-OH-D
3
XICs because the
integration of the analyte peak is easier and more accurate.
An example of the impact of these interferences on peak
integration is shown in Figures 4A and 4B. Here, the result
for an individual with normal levels of 25-OH-D
3
would
be reported incorrectly due to the high level of interference
merging with the analyte peak, and thus, affecting the peak
integration.
Conclusion
The TurboFlow method described here has been developed
and validated to industry recommended guidelines for
clinical laboratories.
Isobaric interferences observed with a 1D LC-MS/
MS method at low 25-OH D
3
metabolite concentrations
were much reduced by using a 2D-LC-MS/MS approach,
and even further improved by using TurboFlow technol-
ogy. The Transcend™ TLX-1 LC-MS/MS with TurboFlow
technology improved the sensitivity and the signal-to-noise
ratio.
A
Interference
3.0
3.2
3.4
3.6
3.8
4.0
4.2
4.4
Time (min)
0
10
20
30
40
50
60
70
80
90
100
0
10
20
30
40
50
60
70
80
90
100
Relative Abundance
3.61
3.64
25-OH-D
3
25-OH-D
2
B


