
-ASS 3PECTROMETRY
MS analysis was carried out on a Thermo Scientific TSQ
Quantum Ultra triple stage quadrupole mass spectrometer.
Atmospheric pressure chemical ionization (APCI) was used
to generate the [M-H
2
O]+ ion for 25-OH vitamin D
3
, D
2
and the IS.
Results and Discussion
Example calibration lines for the D
3
and D
2
metabolites
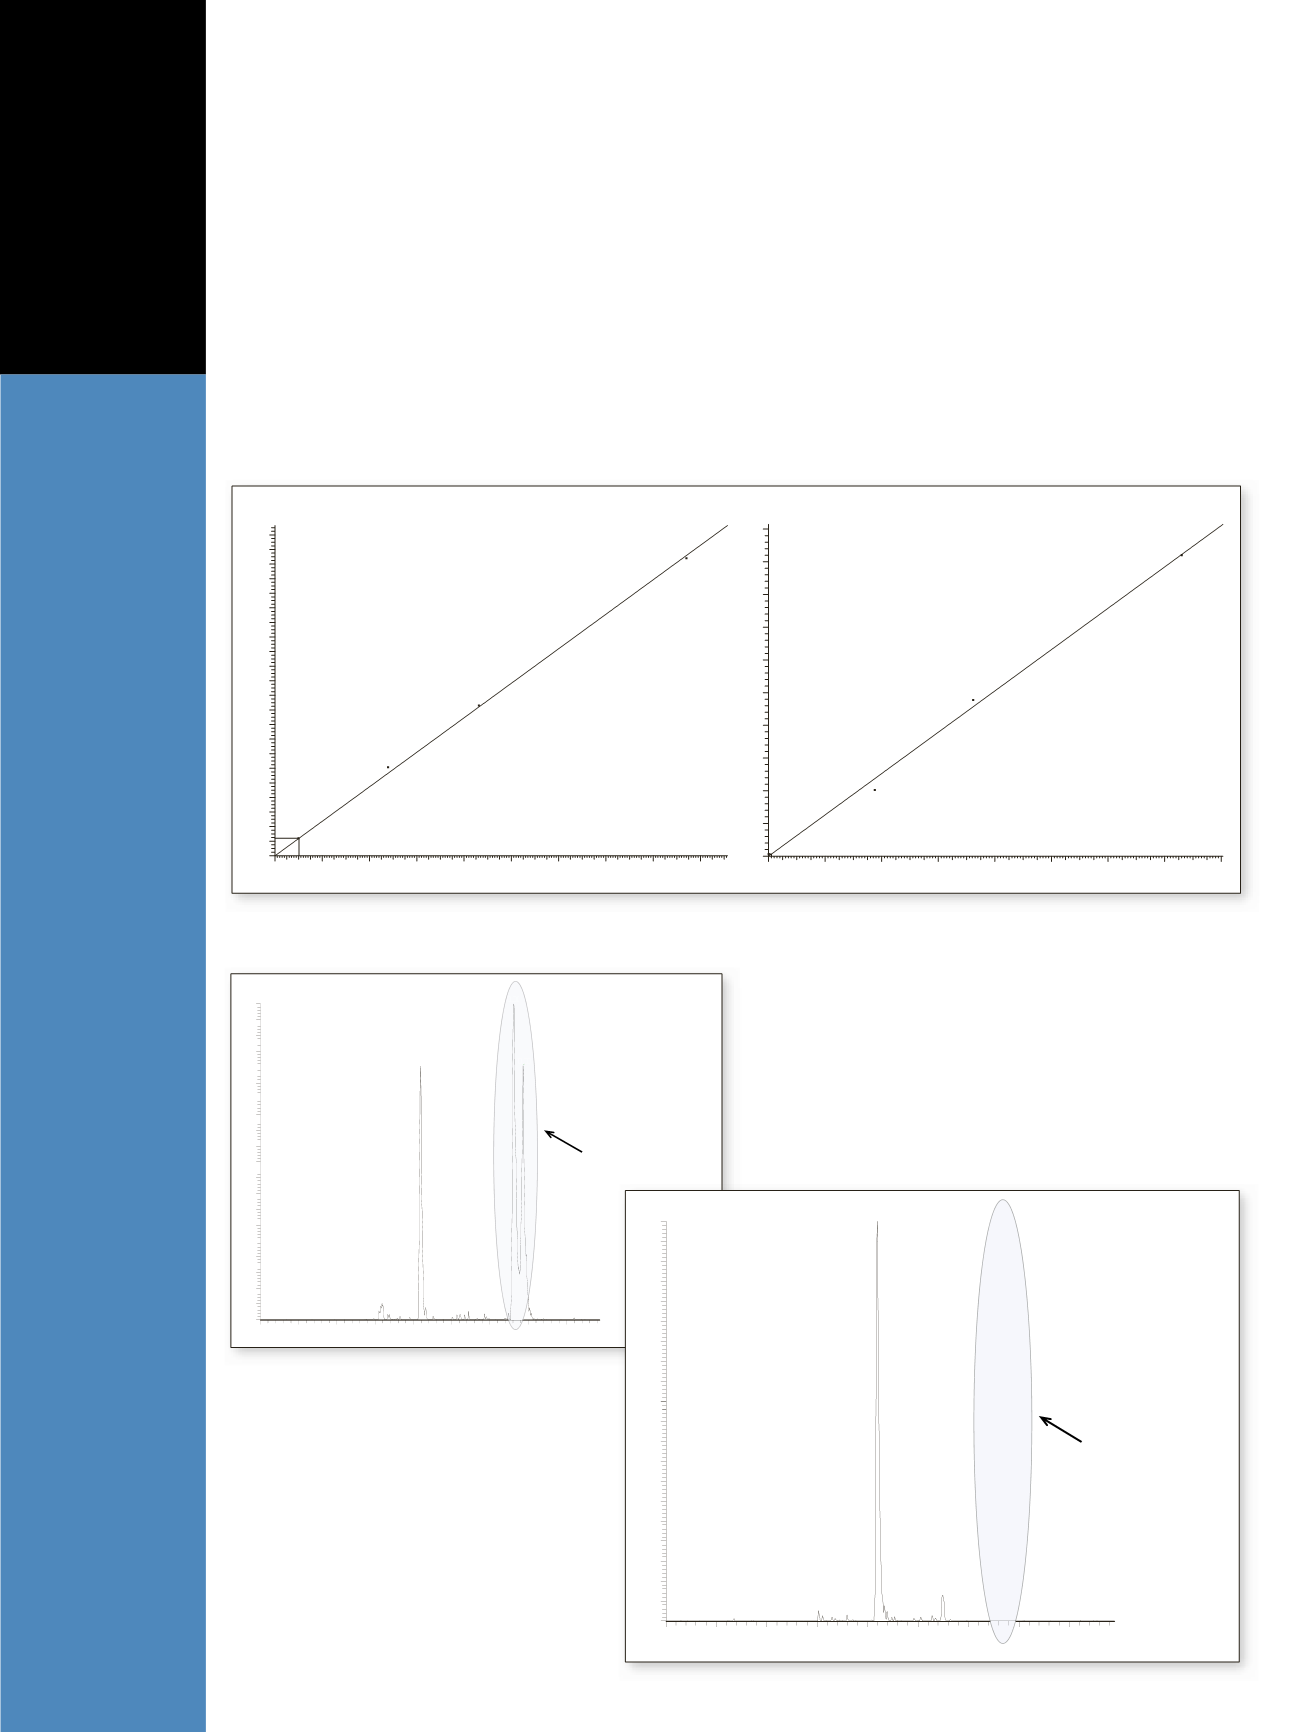
analyzed by the TurboFlow LC-MS/MS method are pre-
sented in Figures 1A and 1B.
Examples of a plasma sample analyzed by the 1D
LC-MS/MS method and by the TurboFlow method are
provided in Figures 2A and 2B, respectively. There is an
interference peak observed in the LC-MS/MS 25-OH-D
3
selected reaction monitoring (SRM) extracted ion chro-
matogram (XIC). This is commonly observed in analyses
where only 1D LC-MS/MS is utilized. When using the
TurboFlow method, the interference is removed and larger
peak areas with better signal-to-noise ratios are achieved.
25OHD3
Y = 0.00236607*X R^2 = 0.9989 W: Equal
0
20
40
60
80
100
120
140
160
180
nmol/L
0.00
0.02
0.04
0.06
0.08
0.10
0.12
0.14
0.16
0.18
0.20
0.22
0.24
0.26
0.28
0.30
0.32
0.34
0.36
0.38
0.40
0.42
0.44
Area Ratio
25OHD2
Y= 0.00315854*X R^2 = 0.9965 W: Equal
0
20
40
60
80
100
120
140
160
0.00
0.05
0.10
0.15
0.20
0.25
0.30
0.35
0.40
0.45
0.50
25-OH-D
2
25-OH-D
3
Figure 1. Calibration curves for 25-OH vitamin D
3
(A) and 25-OH vitamin D
2
(B) by TurboFlow LC-MS/MS.
1.5
2.0
2.5
3.0
3.5
4.0
4.5
5.0
5.5
Time (min)
0
5
10
15
20
25
30
35
40
45
50
55
60
65
70
75
80
85
90
95
100
RelativeAbundance
4.81
4.93
3.59
1D LC-MS/MS
Peak area: 48,892
S:N: 1242
SRM interferences
Figure 2. (A) XIC for 25-OH vitamin D
3
by 1D LC-MS/
MS and (B) XIC for 25-OH vitamin D
3
by TLX-LC-MS/
MS.
A
A
B
1.5
2.0
2.5
3.0
3.5
4.0
4.5
5.0
5.5
6
Time (min)
0
5
10
15
20
25
30
35
40
45
50
55
60
65
70
75
80
85
90
95
100
Relative Abundance
3.60
TurboFlow
method
Peak area: 65,130
S:N: 4167
No SRM interferences
B


