
2. SPE Recovery
Extraction efficiency was assessed in charcoal stripped serum (CSS, n=3).
Absolute recovery of Pmets and IS ranged from 86.4% to 97.5%, and the
relative recovery of MN and NMN was 97.7% and 113.5%, respectively
(Table 1).
Table 1. SPE Recovery
In Charcoal
Spiked before
Spiked after
Absolute
Relative
Stripped Serum
SPE
a
(mean ± CV)
SPE
b
(mean ± CV)
Recovery (%) Recovery (%)
MN (n=3)
22865 ± 13.9% 25265 ± 9.3% 90.5
97.7
NMN (n=3)
11165 ± 11.1% 11453 ± 12.5% 97.5
113.5
MN-d3 (n=3)
27809 ± 7.2% 30140 ± 12.9% 92.3
n/a
NMN-d3 (n=3)
22627 ± 9.2% 26192 ± 4.5% 86.4
n/a
a
Measured peak area of charcoal stripped serum spiked with 100, 400, 400, and 1600 pg/mL of MN, NMN, MN-d3, and
NMN-d3, respectively, before SPE
b
Measured peak area when equivalent amounts of above compounds were spiked after SPE
3. Ion Suppression
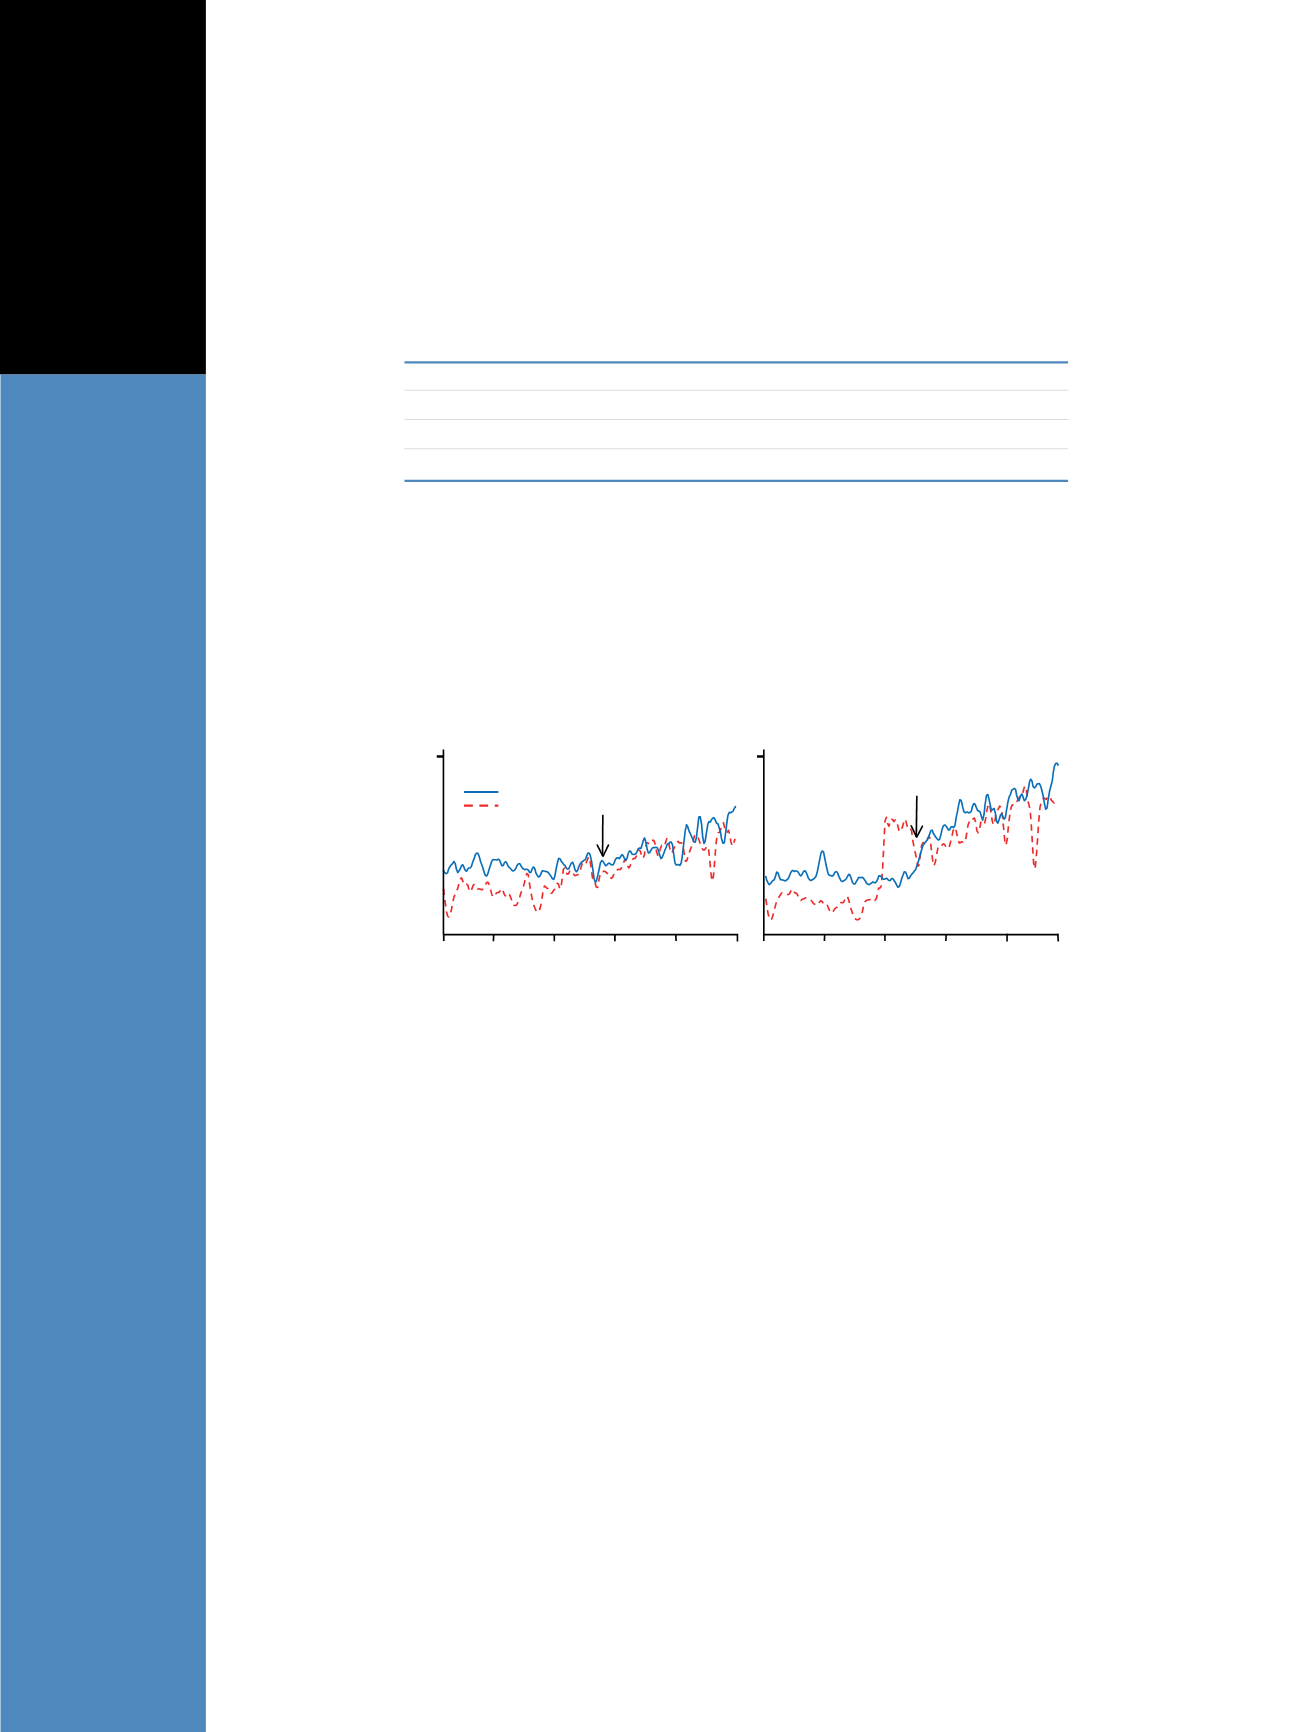
Results from the post-column infusion experiments are shown in
Figure 2. Compared to injections of blanks, no obvious ion suppression was
detected in the SRM chromatograms of MN-d3 and NMN-d3 using processed
human plasma samples.
Retention Time (min)
Relative Abundance
1.5
2.5
3.5
4.5
5.5
100
1.5
2.5
3.5
4.5
5.5
100
Blank
Plasma
MN-d3
NMN-d3
Figure 2. Representative SRM chromatograms of post-column infusion of 100 ng/mL MN-d3 (left) and
NMN-d3 (right) after injections of buffer blanks (solid lines) and processed human plasma samples
(dashed lines). No internal standards were added to human plasma samples. Arrows indicate retention
times of MN and NMN.
4. LLOQ, Linearity and Accuracy
It was determined that CSS is a suitable matrix to conduct this part of valida-
tion (mixing study, data not shown). CSS samples with progressively lower
concentrations of MN and NMN were prepared in triplicate along with one set
of CSS calibrators.
The linearity range was determined to be 7.2 - 486.8 pg/mL for MN and
18.0 - 989.1 pg/mL for NMN (Figure 3). Accuracy ranged from 92.2% to
118.0% for MN, and from 92.1% to 115.0% for NMN. The determined
LLOQ was 7.2 pg/mL for MN and 18.0 pg/mL for NMN.
Figures 3 and 4 show the calibration curves for MN and NMN.
Figure 5 shows the representative SRM chromatograms of MN and NMN at
their LLOQ in CSS.


