
calibrators and compared to expected concentrations to
calculate recovery (Table 2).
Table 2. Recovery
1,25D
2
1,25D
3
Expected
Measured Recovery
Expected Measured Recovery
(pg/mL)
(pg/mL)
(%)
(pg/mL)
(pg/mL)
(%)
43.7
45.0
103.0
11.1
11.1
100.0
48.7
47.3
97.2
16.1
17.4
108.5
58.7
57.0
97.1
26.1
27.7
106.5
88.7
99.5
112.2
56.1
57.6
102.7
238.7
235.9
98.8
206.1
203.2
98.6
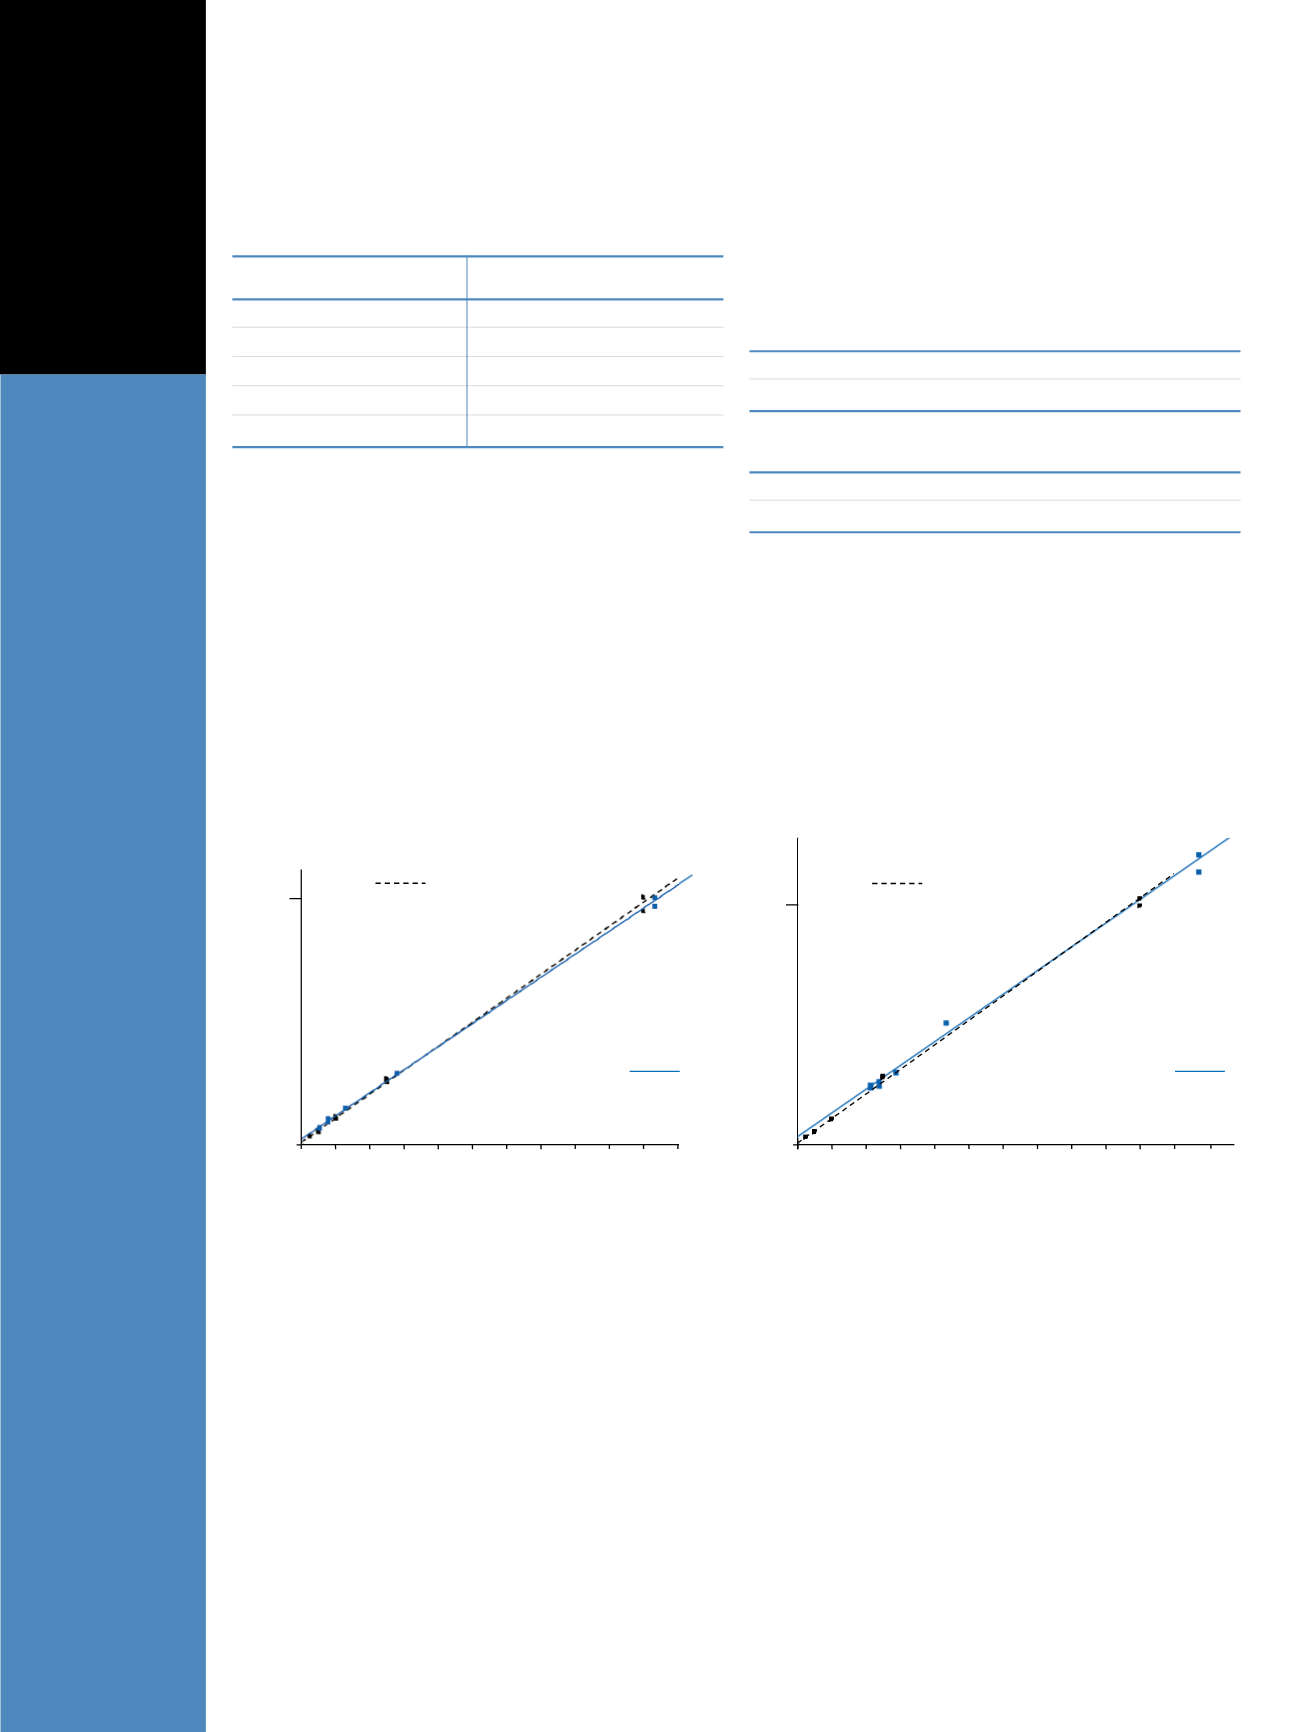
The slopes of the calibration curves of 1,25D
2
and D
3
in
both solvent and pooled human plasma calibrators were
compared and found to be nearly identical (Figures 1
and 2). This indicated that 1,25D originated from spiked
solvent and 1,25D originated from human plasma behaved
similarly relative to their corresponding IS during the
whole process of immunoextraction and LC-MS/MS.
The method was linear between 5 and 200 pg/mL for
both 1,25D
2
and 1,25D
3
. The LLOQ was 5 pg/mL for
both 1,25D
2
and D
3
. Figure 3 shows the representative
SRM chromatograms of 1,25D
2
and 1,25D
3
of the lowest
calibrator in solvent and pooled human plasma.
3. Precision
Precision was determined with spiked charcoal stripped
serum at both 10 and 20 pg/mL, which are close to the
LLOQ (Table 3).
Table 3. Precision
Measured
Accuracy
Precision
1,25D
2
(pg/mL)
(%)
(%)
10 pg/mL
9.1
90.8
8.4
20 pg/mL
19.8
99.2
7.4
1,25D
3
10 pg/mL
9.9
98.8
12.5
20 pg/mL
20.9
104.4
11.1
0
40
80
120
160
200
0
Concentration (pg/mL)
Area Ratio
Solvent
Y = 0.0231 + 0.0050X
R
2
= 0.9984 W: 1/X
1
Pooled human plasma
Y = 0.0376 + 0.0048X
R
2
= 0.9983 W: 1/X
Figure 1. Calibration curves of 1,25D
2
in solvent (dotted line, black) and
pooled human plasma (solid line, blue)
Concentration (pg/mL)
Area Ratio
0
40
80
120
160
200
0
Solvent
Y = 0.0562 + 0.0130X
R
2
= 0.9976 W: 1/X
2.5
Pooled human plasma
Y = 0.1066 + 0.0121X
R
2
= 0.9922 W: 1/X
Figure 2. Calibration curves of 1,25D
3
in solvent (dotted line, black) and
pooled human plasma (solid line, blue)


