
5. Precision
Precision results are summarized in Table 2.
A) CSS samples: Precision was first assessed with spiked
CSS at two concentration levels (25 and 250 pg/mL for
MN, and 50 and 500 pg/mL for NMN). Inter- (n=15)
and intra-batch (n=5) CV values ranged from 2.1% to
10.9%.
B) Pooled human plasma samples: Precision was also as-
sessed with a spiked human plasma pool (35.6 pg/mL
of MN and 53.1 pg/mL of NMN, n=5). The determined
intra-assay CV (n=5) was 6.3% and 7.8% for MN and
NMN, respectively.
Table 2. Precision Data in Spiked CSS
MN
NMN
25 pg/mL 250 pg/mL
50 pg/mL 500 pg/mL
Intra-assay Precision (%) n=5 10.9
4.6
9.6
2.1
Accuracy (%)
98.9
96.9
110.2
90.9
Inter-assay Precision (%) n=15 10.3
6.5
10.6
5.6
Accuracy (%)
100.6
102.7
108.7
97.4
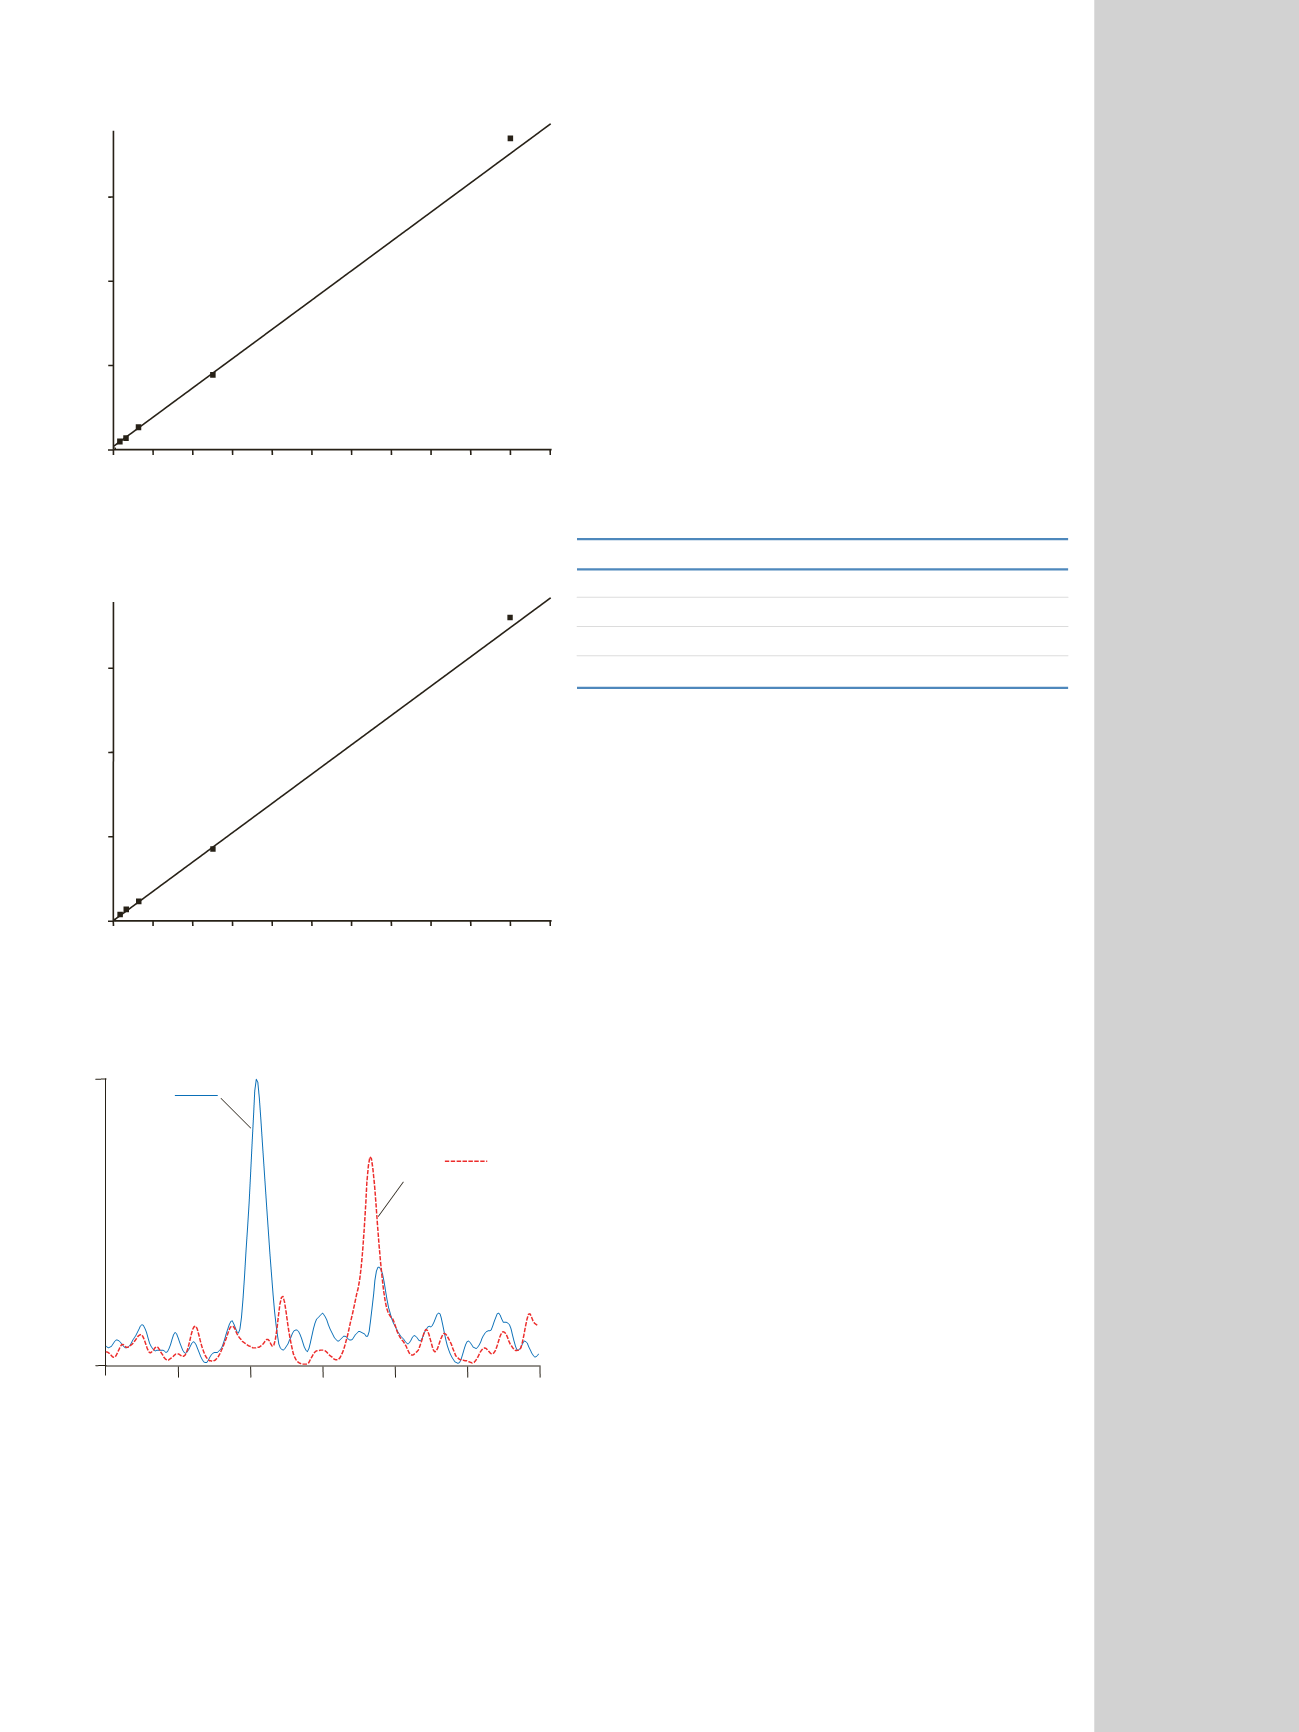
Figure 6 shows representative SRM chromatograms of
MN and NMN using a processed human plasma sample.
6. Carryover
No carryover was observed up to 500 and 1000 ng/mL for
MN and NMN, respectively.
0
100
200
300
400
500
0
Concentration (pg/mL)
Area Ratio
MN
Y = 0.0201 + 0.0036X
R
2
= 0.9914 W: 1/X
2
0.5
1.0
1.5
0
200
400
600
800 1000
0
Concentration (pg/mL)
Area Ratio
NMN
Y = 0.0021 + 0.0011X
R
2
= 0.9968 W: 1/X
2
0.3
0.6
0.9
MN:
m/z
180 148
7.2 pg/mL
NMN:
m/z
166 134
18.0 pg/mL
Retention Time (min)
2.8
2.95
3.1
3.25
3.4
3.55 3.7
0
340
Intensity
Figure 3. Calibration curve of MN in CSS
Figure 4. Calibration curve of NMN in CSS
Figure 5. Representative SRM chromatograms of MN and NMN at their LLOQ
in a spiked CSS sample.


