
2
For Clinical Research Use Only. Not for Diagnostic Procedures
Figure 2
0
200
400
600
800
1000
0
Concentration (pg/mL)
Area Ratio
E1
Y=0.0137+0.028X
R
2
= 0.9949 W: 1/X
2
30
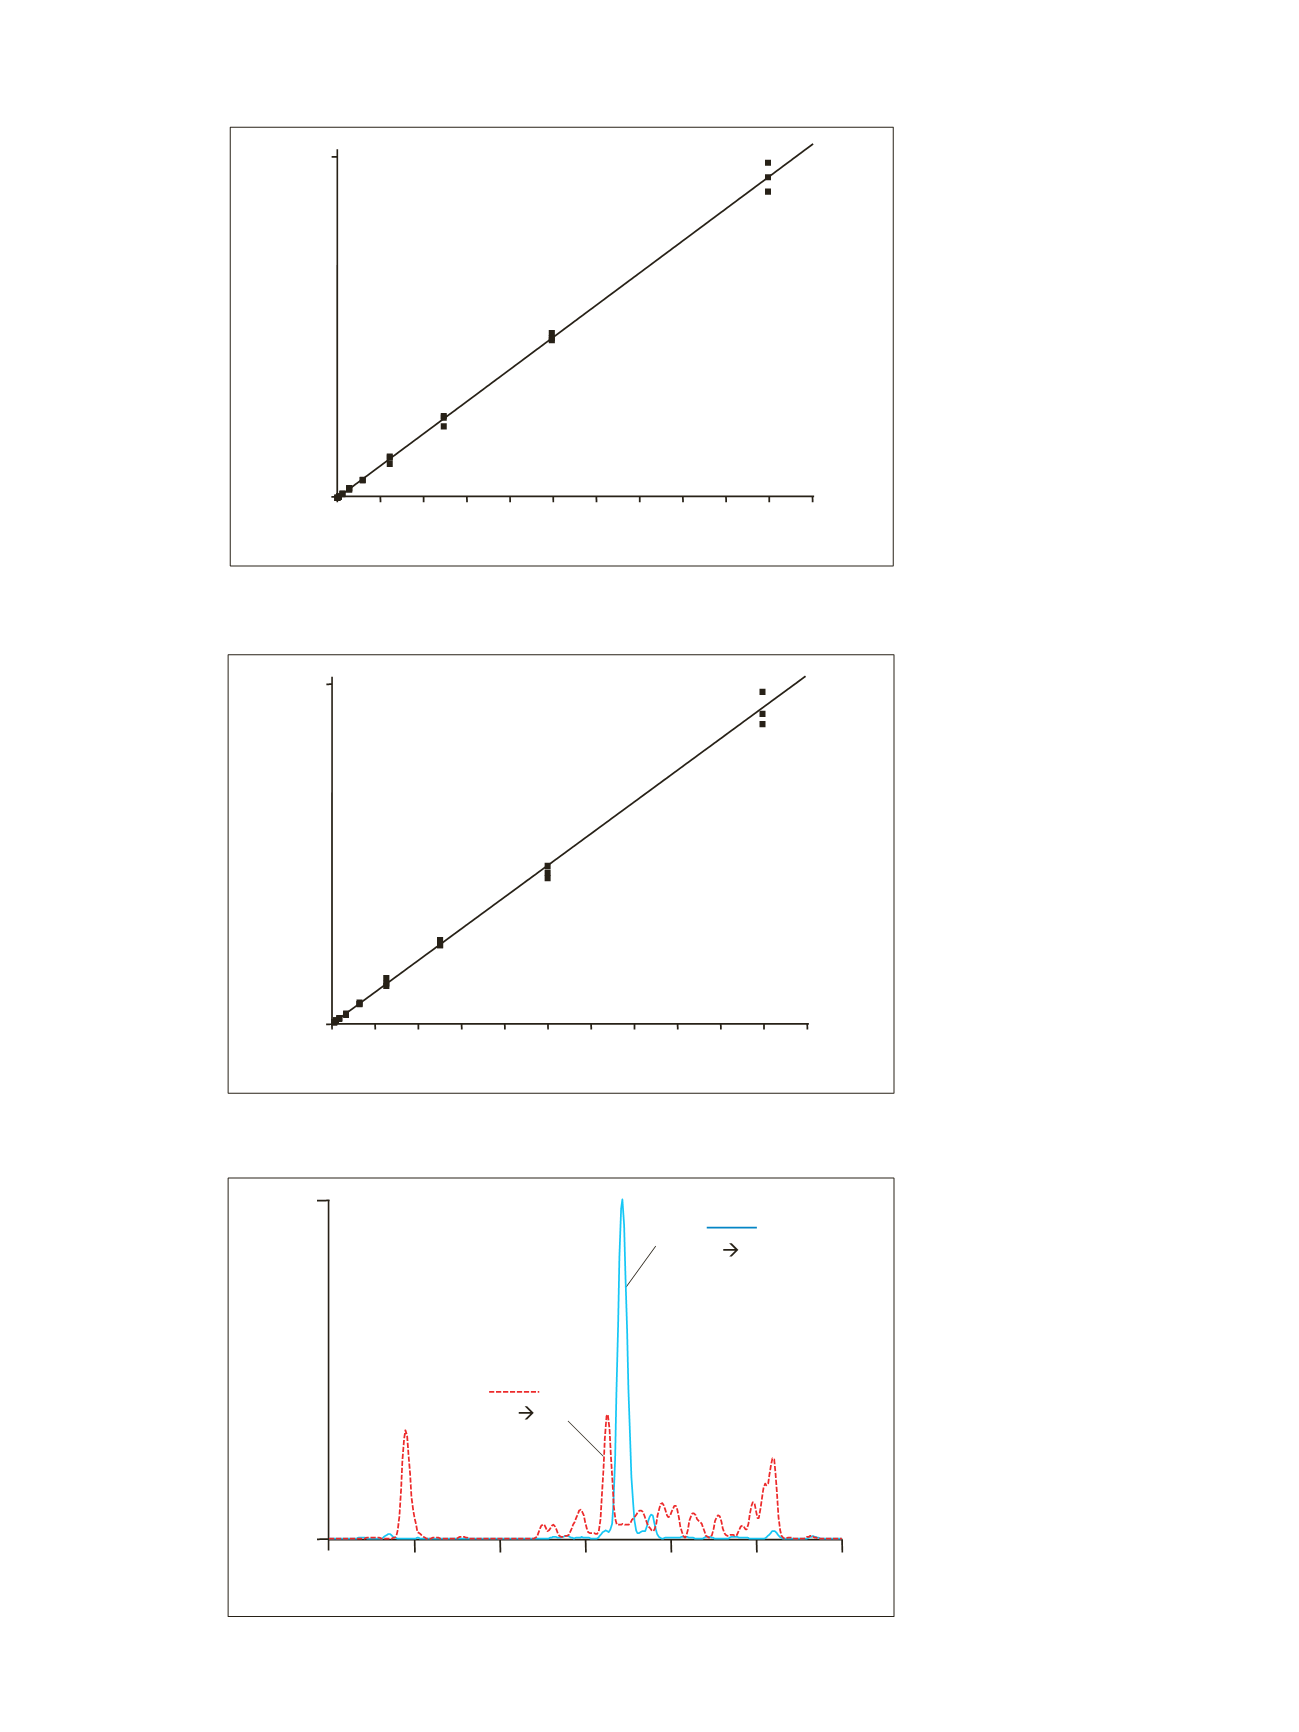
Figure 2. Calibration curve of E1 in CSS
Figure 3. Calibration curve of E2 in CSS
3
For Clinical Research Use Only. Not for Diagnostic Procedures
Figure 3
0
200
400
600
800
1000
0
Concentration (pg/mL)
Area Ratio
E2
Y=-0.00396+0.0092X
R
2
= 0.9885 W: 1/X
2
10
Figure 4. SRM chromatograms of E1 and E2 at their LLOQ in spiked CSS
4
For Clinical Research Use Only. Not for Diagnostic Procedures
Figure 4
Retention Time (min)
6.2
6.5
6.8
7.1
7.4
7.7
8.0
0
100
E1:
m/z
269
145
3.8 pg/mL
E2:
m/z
271
183
3.7 pg/mL
Intensity


