
3
Precision
Precision was assessed with spiked CSS. Inter- and
intra-assay CV values at low and high quality control
concentrations of both analytes varied between 2.0% and
10.5% (Table 3).
Ion Suppression
The MS responses of MN-d3 and NMN-d3 in solvent
(n=4) and individual human plasma samples (n=4) at the
same concentrations (400 pg/mL for both MN-d3 and
NMN-d3) were measured with LC-MS/MS analysis.
The average MS responses (integrated area) of MN-d3
and NMN-d3 from solvent and real human plasma
samples were calculated. The intensity ratios with
standard deviations between human plasma (n=4) and
solvent (n=4) were 113.3% ± 18.4% and 126.4% ±
18.0% for MN-d3 and NMN-d3, respectively. This
indicated that this method has no obvious ionization
suppression or enhancement.
Carryover
No carryover was observed.
Interferences
Epinephrine (EPI) and NMN share the same SRM
transitions and could not be differentiated just by MS/MS
analysis. Using the Hypercarb
™
analytical column, the EPI
peak was baseline resolved from the NMN peak
(0.3 min apart, data not shown).
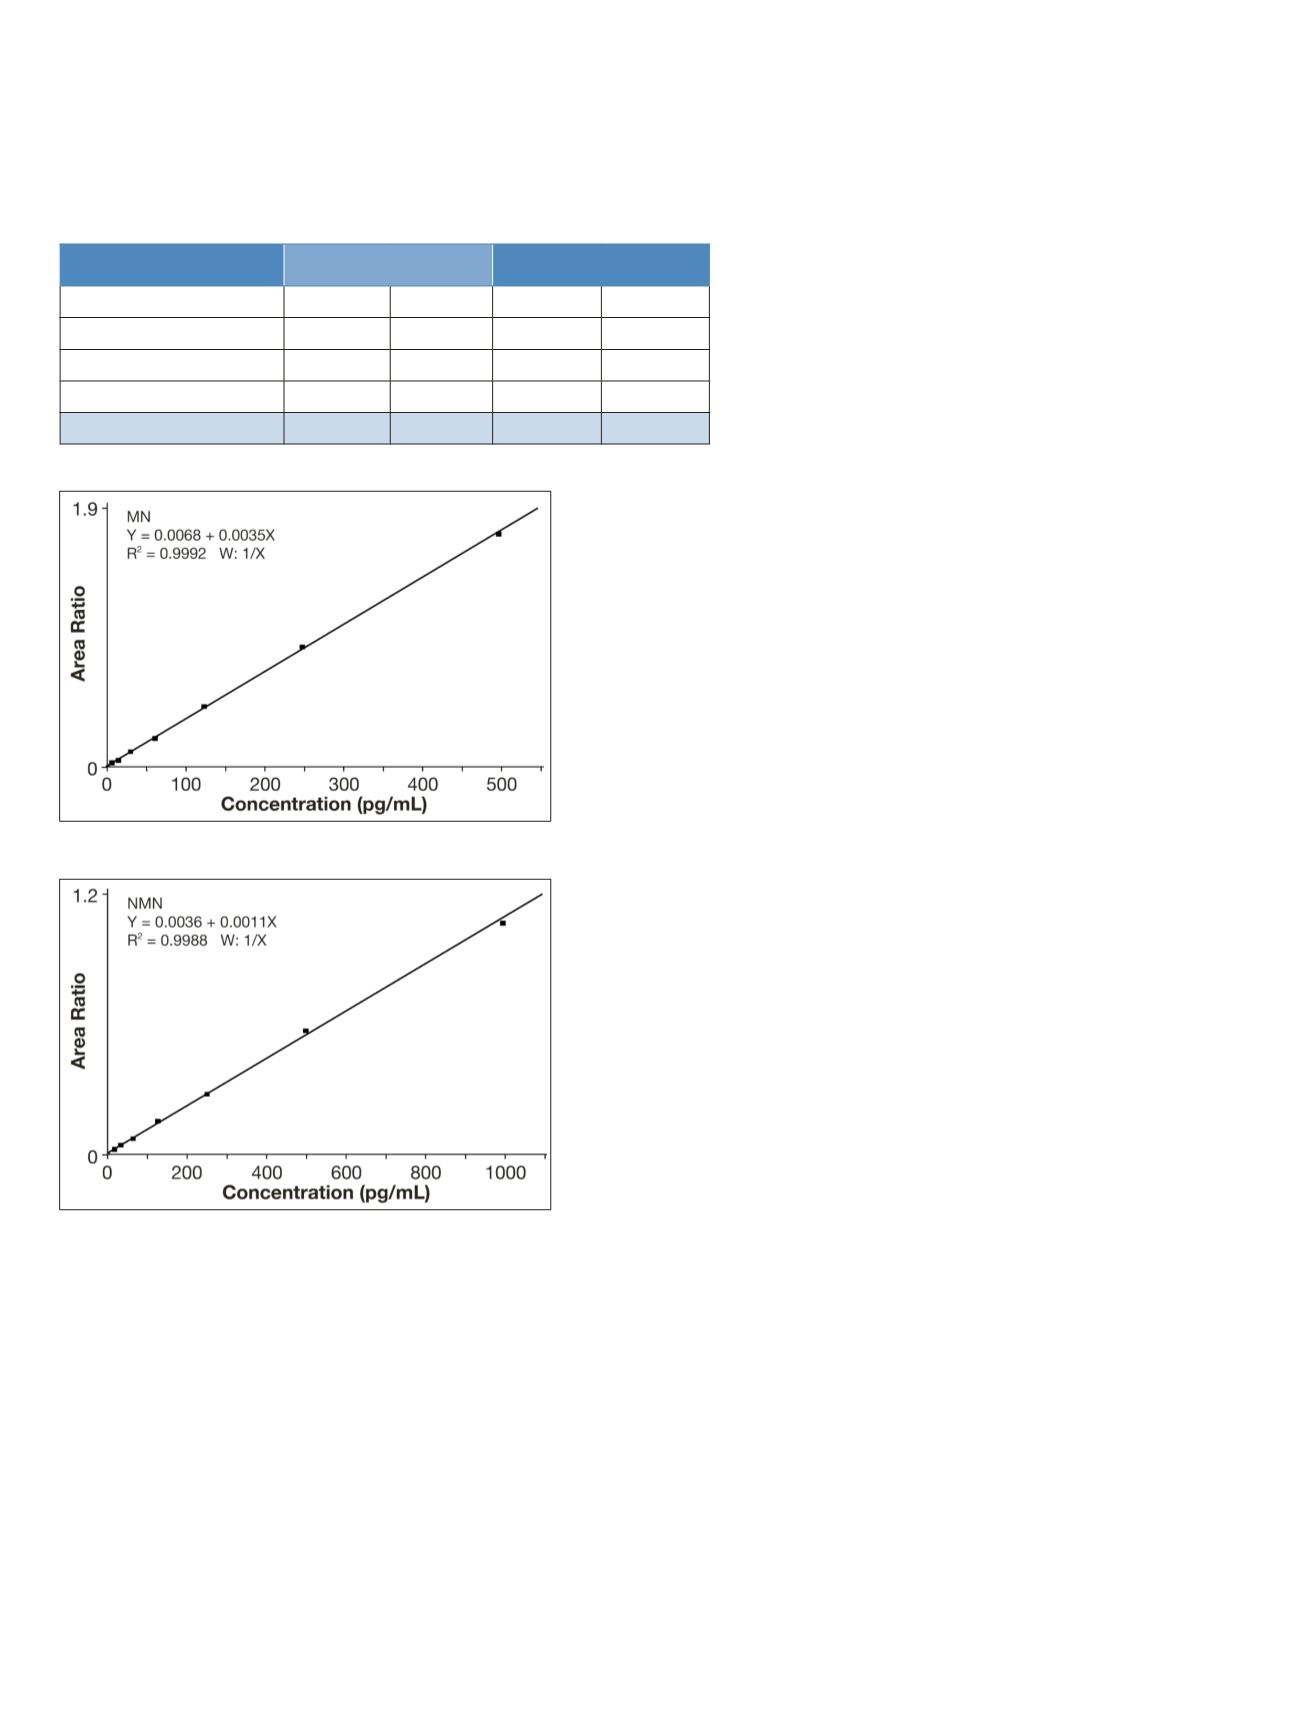
Figure 3. Calibration curve of NMN in CSS
Figure 2. Calibration curve of MN in CSS
Charcoal Stripped Serum 31.3 pg/mL 250.0pg/mL 62.5 pg/mL 500.0pg/mL
Intra 1 (%) n=5
6.7
4.2
4.5
5.4
Intra 2 (%) n=5
4.9
3.0
10.5
4.2
Intra 3 (%) n=5
7.3
4.7
10.0
2.0
Inter-assay (%) n=15
8.4
7.7
8.9
4.8
MN
NMN
Table 3. Precision data


