
2
Samples were prepared by adding 200 µL of precipitating
reagent containing internal standard to each centrifuge
tube containing 100 µL of calibrants and controls.
Tubes were vortexed for 30 seconds and then centrifuged
at 5,000 RCF for 10 minutes. Supernatants were then
aliquoted into autosampler vials for analysis. Calibration
curves and QCs were run in triplicate each day across
four days. In addition, 800 pooled serum sample replicates
containing 20 ng/mL 25-hydroxyvitamin D
2
and 25-
hydroxyvitamin D
3
and 50 ng/mL of D
6
-25-hydroxy-
vitamin D
3
internal standard were injected to test
robustness of the method. Thermo Scientific Xcalibur
software was used to collect data and analyze the results.
The Exactive Plus mass spectrometer was used with an
APCI source in positive ionization mode. Full-scan data
was collected from
m/z
350 to 425.
LC/MS Conditions
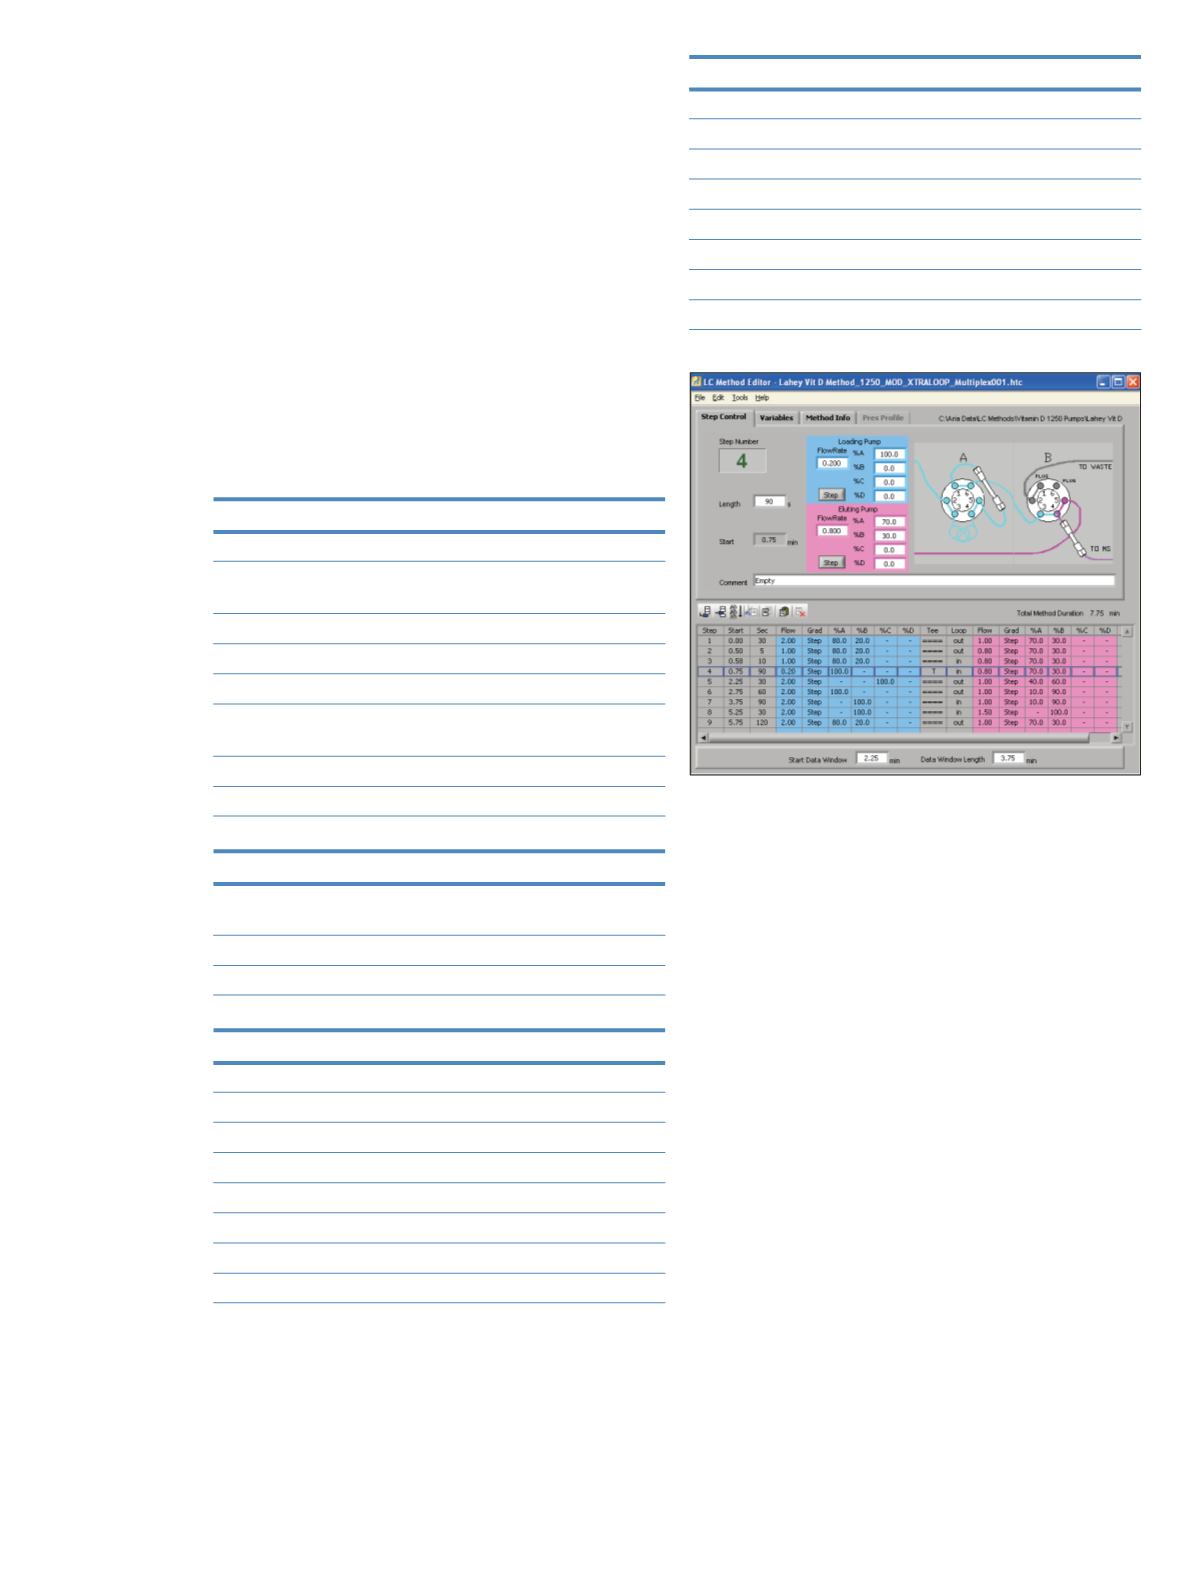
TurboFlow Method Parameters (see also Figure 2)
Plumbing mode:
Focus Mode
Column:
Thermo Scientific TurboFlow XL
C-18P 0.5 x 50 mm
Injection volume:
50 µL
Solvent A:
0.1% formic acid in water
Solvent B:
0.1% formic acid in methanol
Solvent C:
40:40:20 acetonitrile: isopropyl
alcohol: acetone (v:v:v)
Analysis time:
7.75 minutes
Cycle time when multiplexed 4x: 1.9 minutes
HPLC Method Parameters
Analytical column:
Thermo Scientific Accucore C18
3 x 50 mm 2.6 µm
Solvent A:
0.1% formic acid in water
Solvent B:
0.1% formic acid in methanol
Mass Spectrometer Parameters
Scan mode:
Full
Scan range:
m/z
350 – 425
Fragmentation:
None
Polarity:
Positive
Microscans:
1
Resolution:
70,000
AGC target:
3 x 10
6
Maximum inject time:
200
Ion Source Parameters
Ion source:
APCI
Discharge current:
3.5 uA
Vaporizer temperature:
500 °C
Sheath gas pressure:
30 units
Ion sweep gas pressure:
1 unit
Aux gas pressure:
5 units
Capillary temperature:
250 °C
S-Lens RF level:
60
Figure 2: TurboFlow method details
Figure 2. TurboFlow method details
Results and Discussion
The lower limit of quantitation (LLOQ) was determined
to be 2 ng/mL for both analytes in BSA as indicated in
Figure 3. Limits of quantitation (LOQs) were estimated
from the triplicate injections of the standard solutions.
The signal-to-noise ratio was greater than 10 and the
coefficient of variation (CV) values were less than 10%
at the LLOQ of 2 ng/mL for both 25-hydroxyvitamin D
2
and 25-hydroxyvitamin D
3
(Table 1). The correlation
coefficients obtained using 1/X weighted linear regression
analysis of the standard curves were greater than 0.99 for
both analytes (Figures 4 and 5). A relative standard
deviation (%RSD) test was performed in pooled human
serum fortified with analytes at 20 ng/mL and crashed
with internal standard solution for a total internal
standard concentration of 50 ng/mL. The RSDs of ten
replicate injections were less than 10% for both analytes
(Table 2). A recovery study was also performed using a
neat standard of 20 ng/mL 25-hydroxyvitamin D
2
and
25-hydroxyvitamin D
3
with 50 ng/mL D
6
-25-hydroxy-
vitamin D
3
. The standard was injected ten times on the
TurboFlow™ column and analytical column, and ten
times on the analytical column only, and area counts were
compared. The relative recoveries were 97% and 99% for
25-hydroxyvitamin D
2
and 25-hydroxyvitamin D
3
,
respectively.


